
AI in Customer Success: From Productivity to Revenue
By Munish Gandhi · Founder & CEO, Statisfy
Most CS teams have now deployed AI. Almost none are measuring it in dollars.
When CS leaders are asked what AI has done for their team, the answer is almost always the same: it saves time on call summaries, helps draft follow-up emails, and flags some sentiment signals in support tickets. These are real improvements. But they are productivity improvements, not revenue improvements. And in a world where CS is increasingly measured on net revenue retention, the distinction is what separates a CS org that grows headcount from one that gets restructured.
“The average CS team reports saving 3–4 hours per week per CSM from AI tools. Fewer than one in four CS leaders can quantify how that time savings translated into renewed or expanded revenue.”
This guide covers the three stages of AI maturity in customer success, what moves the needle at each stage, and the specific capabilities that separate teams with improving NRR from teams watching it plateau.
The 3-Stage AI Maturity Model for Customer Success
Quick answer: Stage 1 AI saves time. Stage 2 AI prevents churn. Stage 3 AI drives expansion. Most teams are stuck at Stage 1. Moving to Stage 2 requires integrating AI into your data stack, not just your communication tools.
Stage 1: Productivity AI (Where 70% of Teams Are Today)
Stage 1 AI tools do one thing: reduce the administrative burden on CSMs. The canonical examples are meeting transcription and summarization (Gong, Otter, Fireflies), AI-generated follow-up email drafts, and automated meeting scheduling. Some teams have added AI-generated sentiment scoring from support tickets or NPS responses.
The ROI model at Stage 1 is straightforward: save CSMs 3–5 hours per week so they can serve more accounts. If a CSM manages 40 accounts today, they can theoretically manage 50. Headcount growth slows.
What Stage 1 does not do: It does not tell you which accounts are actually at risk. It does not surface expansion opportunities. It does not trigger any action without a human first reading the output and deciding to act. Every intervention is still reactive. A CSM reads a summary, decides the account looks fine or at risk, and then decides what to do.
The problem with this model is that CSMs are overwhelmed. When a team is managing 40–60 accounts, the accounts that generate the AI summaries but do not look obviously at risk get deprioritized. This is exactly where churn lives.
Stage 2: Predictive AI (The Retention Lever)
Stage 2 is where AI starts moving revenue metrics. The defining capability is a predictive health score that integrates behavioral data — product usage, feature adoption depth, login frequency, support ticket volume and severity, stakeholder engagement — into a single account risk signal that is accurate enough to trigger action before a human would normally notice a problem. See how to build a health score that actually predicts churn for the signal-by-signal breakdown.
The difference between Stage 1 and Stage 2 is not the sophistication of the model. It is the data integration. Stage 2 requires connecting the AI to your CRM, your product analytics, your support system, and your billing system. When that integration exists, the AI can see what a CSM cannot: that the champion who opened your product twice a week for six months has not logged in for eighteen days, that three support tickets are open simultaneously for the first time ever, and that the renewal is eleven weeks out.
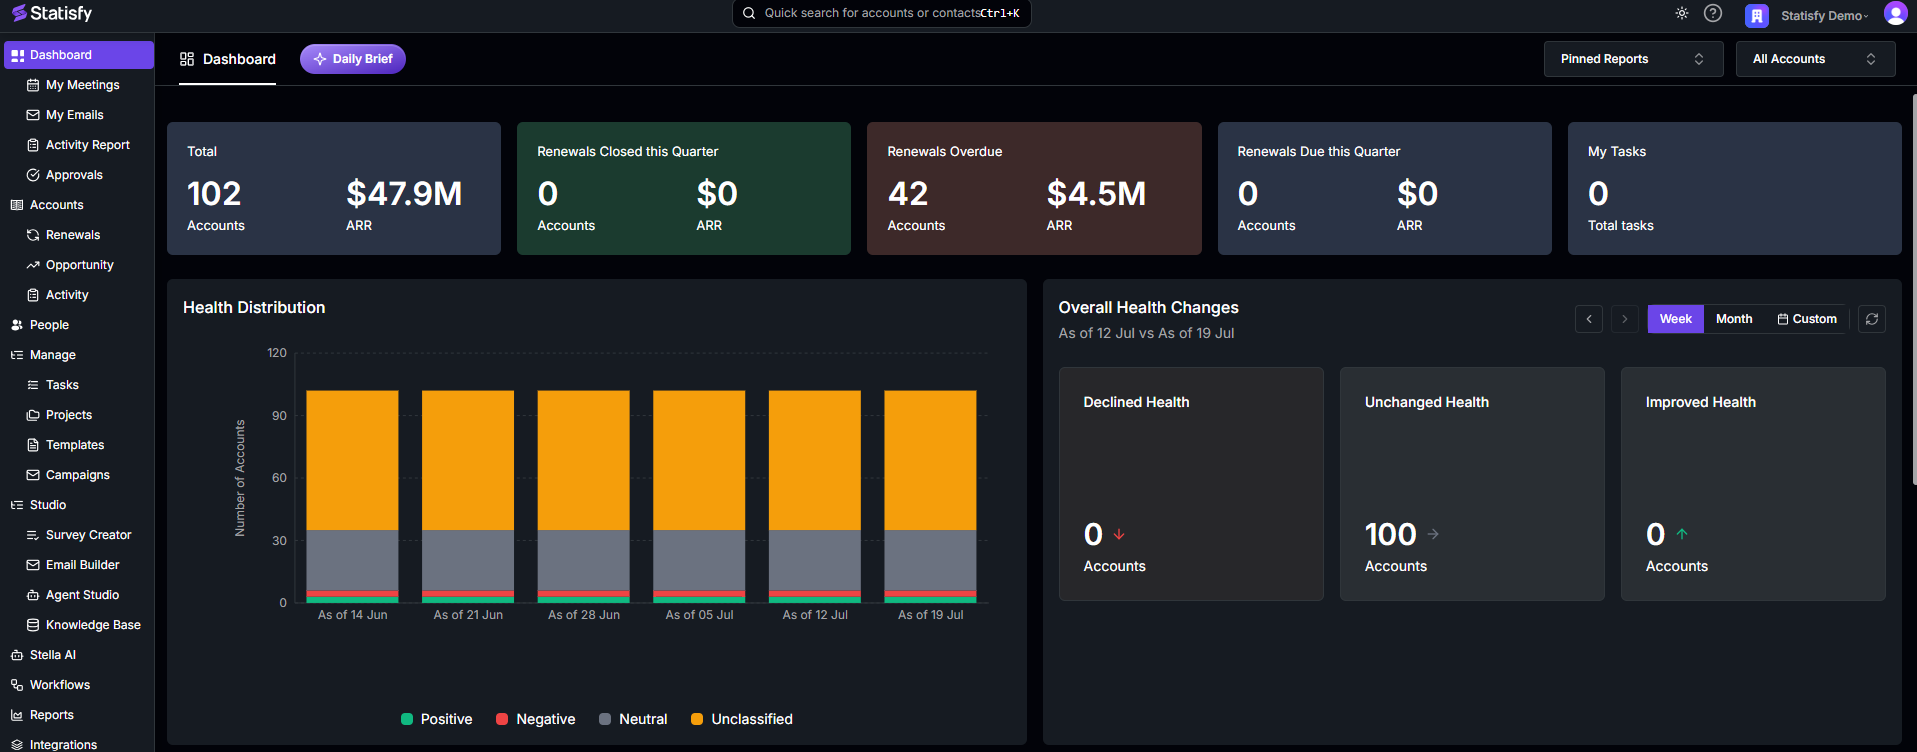
Teams at Stage 2 typically see gross retention improvement of 8–12 percentage points within two renewal cycles. The mechanism is simple: fewer accounts fall into churn without anyone noticing. The AI catches accounts that a human review cadence would have missed.
Stage 3: Autonomous AI (The Expansion Engine)
Stage 3 is where AI stops being a visibility tool and becomes an execution layer. The defining capability is the automated playbook: when an account crosses a risk or opportunity threshold, an action fires without requiring a CSM to first read a report and decide to do something.
On the risk side, this might mean: when a health score drops below 60 and a renewal is inside 90 days, automatically queue a personalized outreach email for CSM review and approval, create a task for the account executive, and notify the VP of CS. On the expansion side: when seat utilization exceeds 80% for three consecutive weeks, surface the account to the CSM with a suggested upsell proposal pre-drafted — see the CS-to-sales handoff playbook for how to route that signal to the right owner.
“CS teams operating at Stage 3 AI maturity report NRR that is 15–20 percentage points higher than Stage 1 teams in the same ARR segment. The primary driver is not fewer churns — it is more expansion caught and closed.”
This is the level where AI moves from a productivity tool to a revenue tool. The CSM’s job shifts from monitoring accounts to reviewing AI-generated actions and approving the ones that make sense.
Why Most Teams Get Stuck at Stage 1
The gap between Stage 1 and Stage 2 is not an AI problem. It is a data integration problem.
Stage 1 tools (Gong, AI email assistants) are SaaS products that plug in independently. They do not need access to your product telemetry or your billing system. They work from meeting recordings and your email thread.
Stage 2 requires integrations. The AI needs to see product usage data (which requires connecting to Mixpanel, Amplitude, Segment, or a custom data warehouse). It needs CRM data (Salesforce or HubSpot). It needs support data (Zendesk or Intercom). And it needs those data sources to be clean enough to build a meaningful signal on.
Most CS teams do not control their data stack. They are dependent on data engineering and rev ops teams that have competing priorities. This is why Stage 1 is where most CS teams stay for longer than they intend to.
Which Stage Is Right for Your Team Now?
See where your team actually sits on this model
Start a free trial and connect your CRM, product, and support data — Statisfy will show you what Stage 2 looks like running against your own accounts.
How to Measure AI’s Revenue Impact (Not Just Time Savings)
If you are justifying AI investment to a CFO or board, time savings is not the metric. The metrics that matter are:
Gross retention rate by cohort, before and after AI deployment. Look at the 12-month renewal rate for accounts that received AI-triggered interventions vs accounts that did not. The delta is the attributable retention lift.
Time-to-intervention on at-risk accounts. Before AI: how many days elapsed between an account showing churn signals and a CSM taking action? After AI: what is that number? A 30-day reduction in intervention lag translates directly into more rescuable accounts.
Expansion ARR sourced by AI signal. Tag every expansion opportunity by whether the initial signal was human-identified or AI-flagged. Over two to three quarters, you will have a clear view of how much expansion revenue exists in the AI-detection category that would otherwise have been missed.
CSM capacity ratio. Accounts managed per CSM before and after Stage 2/3 deployment. This is the efficiency metric CFOs care about — fewer hires needed to scale coverage.
The Fastest Path to Stage 2
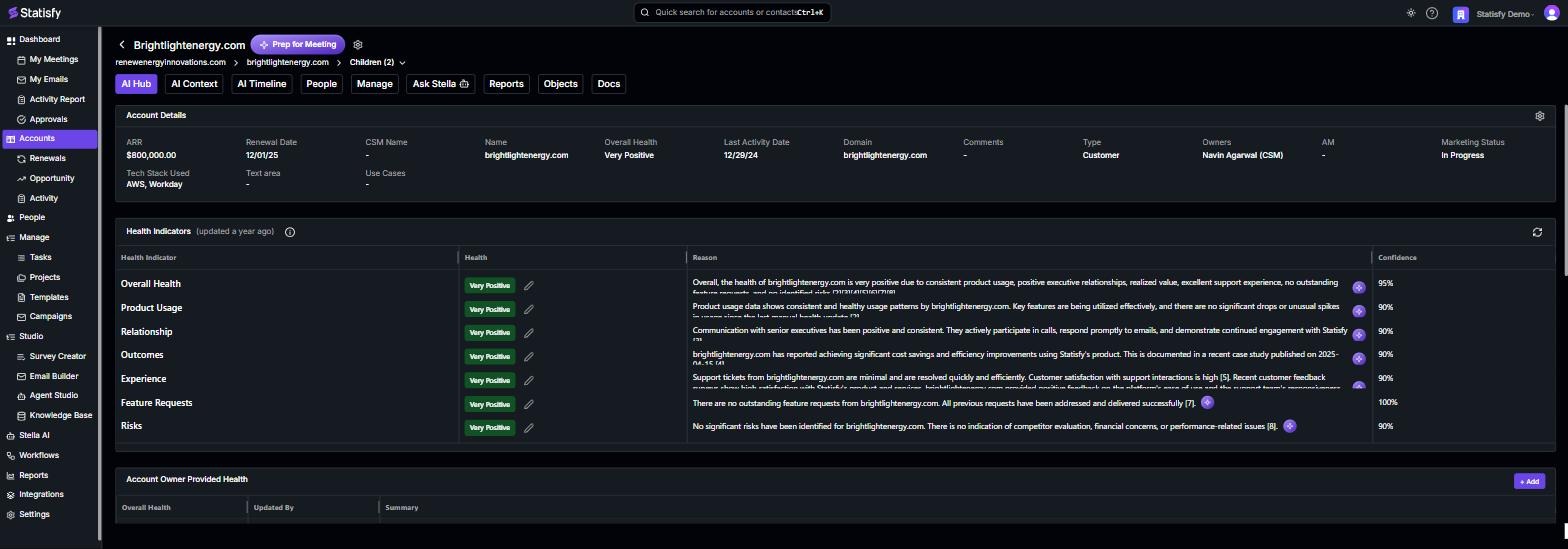
For most CS teams, the fastest route to Stage 2 is a platform that handles the integration layer rather than building it internally. Building a predictive health score from scratch requires data engineering, model training, and ongoing maintenance. For teams without a dedicated CS ops function, this is a multi-quarter project before a single alert fires.
The alternative is a CS platform purpose-built for the integration layer — one that connects to your CRM, product analytics, and support tools and builds the health model from day one, without requiring a developer.
“Teams that deployed an integrated CS intelligence platform reached Stage 2 AI maturity in an average of 6 weeks. Teams that built health scoring internally took an average of 7 months to reach comparable signal accuracy.”
The question for most CS leaders is not whether to pursue Stage 2. It is whether to build it or buy it. The math on build vs buy in this space has shifted decisively toward buy, given how long the build path takes and how fast the underlying models are improving.
From Productivity to Revenue: The Shift That Matters
AI in customer success is not a single technology decision. It is a maturity progression. Stage 1 is table stakes — your team will fall behind if it is not there. Stage 2 is where the retention advantage starts to compound. Stage 3 is where AI becomes a structural competitive advantage, not just an efficiency improvement.
The CS teams that will own retention and expansion in 2026 are not the ones with the best CSMs. They are the ones with the best signal — and the infrastructure to act on it before the customer decides to leave.
Statisfy is an AI-powered CS platform that auto-builds health scores from your existing data stack and triggers intervention playbooks without requiring a Salesforce admin or data engineer. Most teams are live in under a week.
Ready to move past Stage 1?
Start a free trial and see what Stage 2 predictive AI looks like running against your own CRM, product, and support data — no data engineer required.
Compare
How Statisfy compares.
Side-by-side, parameter-by-parameter comparisons with the CS platforms teams evaluate us against.
- Statisfy vs Gainsight Rule-based CTAs vs work already drafted.
- Statisfy vs ChurnZero Plays and ChurnScores vs zero-config action.
- Statisfy vs Vitally Playbook-and-Copilot vs work that's already done.
- Statisfy vs Totango + Catalyst Three products you stitch together vs one platform that acts.
- Statisfy vs Planhat Configurable system of record vs AI-native system of action.
- Statisfy vs Hook ML alerts vs the full loop from signal to autonomous action.
- Statisfy vs Staircase AI Gainsight's communication intelligence add-on vs standalone AI-native platform.