
Unlocking Efficiency with Report Automation
By Navin Agrawal · Co-Founder & Head of AI, Statisfy
What if your most important business reports—from sales dashboards to marketing KPIs—were waiting for you, fully built and ready to go, before you even took your first sip of coffee? That’s the core promise of report automation.
In simple terms, report automation uses software to do the grunt work of gathering, crunching, and presenting business data in a way that’s easy to understand. It’s all about getting your team out of the weeds of manual data entry so they can focus on high-impact strategic thinking. The goal? To make smarter decisions, faster.
Moving Beyond Manual Reporting
Think of the old way of creating reports. It’s a grind. Someone on your team spends hours, maybe even days, exporting data from different systems, wrestling with spreadsheets, copy-pasting numbers, and manually building charts. It’s slow, tedious, and a recipe for human error.
Report automation is like swapping out a bucket and sponge for a smart sprinkler system. Instead of dragging a hose around your lawn every day, you set up a system that knows exactly when and where to deliver water. It just works, reliably and without you lifting a finger.

This technology connects your data sources directly to a reporting tool. You define the rules and design the report once, and the software handles the rest automatically from then on.
The Shift From Data Entry to Data Strategy
The real win here isn’t just about saving a few hours. It’s about changing how your team fundamentally works. When you take the manual reporting burden off your analysts’ shoulders, you free them up to do what they were actually hired for:
- Digging into the data to uncover what’s really going on.- Spotting trends and outliers that a manual process would almost certainly miss.- Building solid strategies based on consistent, real-time information.
This shift turns your team from reactive data janitors into proactive problem solvers. They can finally get ahead of challenges and jump on opportunities instead of just reporting on what already happened.
Automation transforms reporting from a backward-looking chore into a forward-looking strategic asset. It ensures everyone, from team leads to the C-suite, is working from the same, reliable set of numbers.
The momentum behind this shift is undeniable. Just look at the Robotic Process Automation (RPA) market, a technology closely related to many automation tasks. It was valued at USD 28.31 billion in a recent year and is projected to skyrocket to USD 211.06 billion within a decade. That massive growth, detailed in RPA research from Precedence Research, is a clear sign that businesses are hungry for this kind of efficiency.
Manual vs Automated Reporting at a Glance
To really see the difference, a side-by-side comparison makes it crystal clear. This table breaks down the core distinctions between the old-school manual approach and a modern, automated system. AspectManual ReportingAutomated ReportingProcessRepetitive, manual data export, copy-pasting, and formatting.”Set it and forget it” workflow; data is pulled and formatted automatically.Time InvestmentHigh, consuming hours or even days each reporting cycle.Low, with an initial setup followed by minimal ongoing effort.AccuracyProne to human error from manual data handling.High, with consistent, rule-based processing that eliminates mistakes.Strategic ValueLow; the focus is on data collection, leaving little time for analysis.High; frees up teams to focus on strategy, insights, and decision-making. As you can see, the contrast is stark. Automated reporting doesn’t just do the same job faster; it enables a completely different, more strategic way of operating.
The True Business Impact of Automation
The real magic of report automation isn’t just about getting a few hours back in your day. Its value ripples through the entire organization, fundamentally changing how you make decisions and react to market shifts. When you pull the plug on manual reporting, you’re not just speeding things up—you’re kicking off a cascade of positive changes.
One of the first things you’ll notice is a huge leap in data accuracy. Let’s be honest, manual reporting is a minefield of potential mistakes. Every time someone copies and pastes data or punches numbers into a calculator, there’s a chance for a slip-up. Automation sidesteps that risk entirely, making sure the numbers everyone is looking at are the right numbers, every single time.
This reliability fosters something incredibly valuable: trust. When your leadership team can look at a report and have total confidence in the data, they’re empowered to make those big, bold decisions without second-guessing the source.
Freeing Your Team for Strategic Work
But maybe the biggest win is what it does for your people. By taking the mind-numbing task of report building off their plates, you unleash your team’s true potential. Instead of being stuck in a cycle of repetitive tasks, they can finally put their analytical skills to good use.
This shift frees them up to focus on what really moves the needle:
- Strategic Analysis: They can finally dig into the why behind the data, not just endlessly report on the what.- Forecasting and Planning: Using solid data, they can start looking ahead, predicting trends, and getting the business ready for what’s next.- Identifying Growth Opportunities: They have the bandwidth to spot new revenue streams or efficiency gains that were once buried under a mountain of manual work.
When your team stops being a group of historical record-keepers, they become architects of the company’s future. This flips the script, turning the reporting function from a simple overhead cost into a real strategic advantage.
Driving Consistency and Scalability
Automation also brings a level of consistency that’s nearly impossible to achieve manually. It guarantees that everyone—from the CEO down to individual team leads—is working from the same playbook. This single source of truth is crucial for keeping everyone aligned and rowing in the same direction.
On top of that, these systems are designed to grow with you. As your business expands and your data multiplies, an automated reporting setup handles the extra volume without breaking a sweat. It’s an investment that scales alongside your success, not a system that cracks under pressure.
If you want to put hard numbers to these benefits, using an automation ROI calculator can be incredibly helpful. It helps translate the time saved, errors avoided, and strategic gains into a clear financial picture, making the case for automation impossible to ignore.
How Your Reports Get Built Automatically
To really get what report automation is all about, it helps to peek under the hood and see how the gears turn. The whole thing is a surprisingly logical, step-by-step process. Think of it like a master chef preparing a complex meal—it’s a journey that transforms messy, raw ingredients into a valuable asset your team can actually use.
The infographic below gives you a bird’s-eye view of this digital workflow in action.
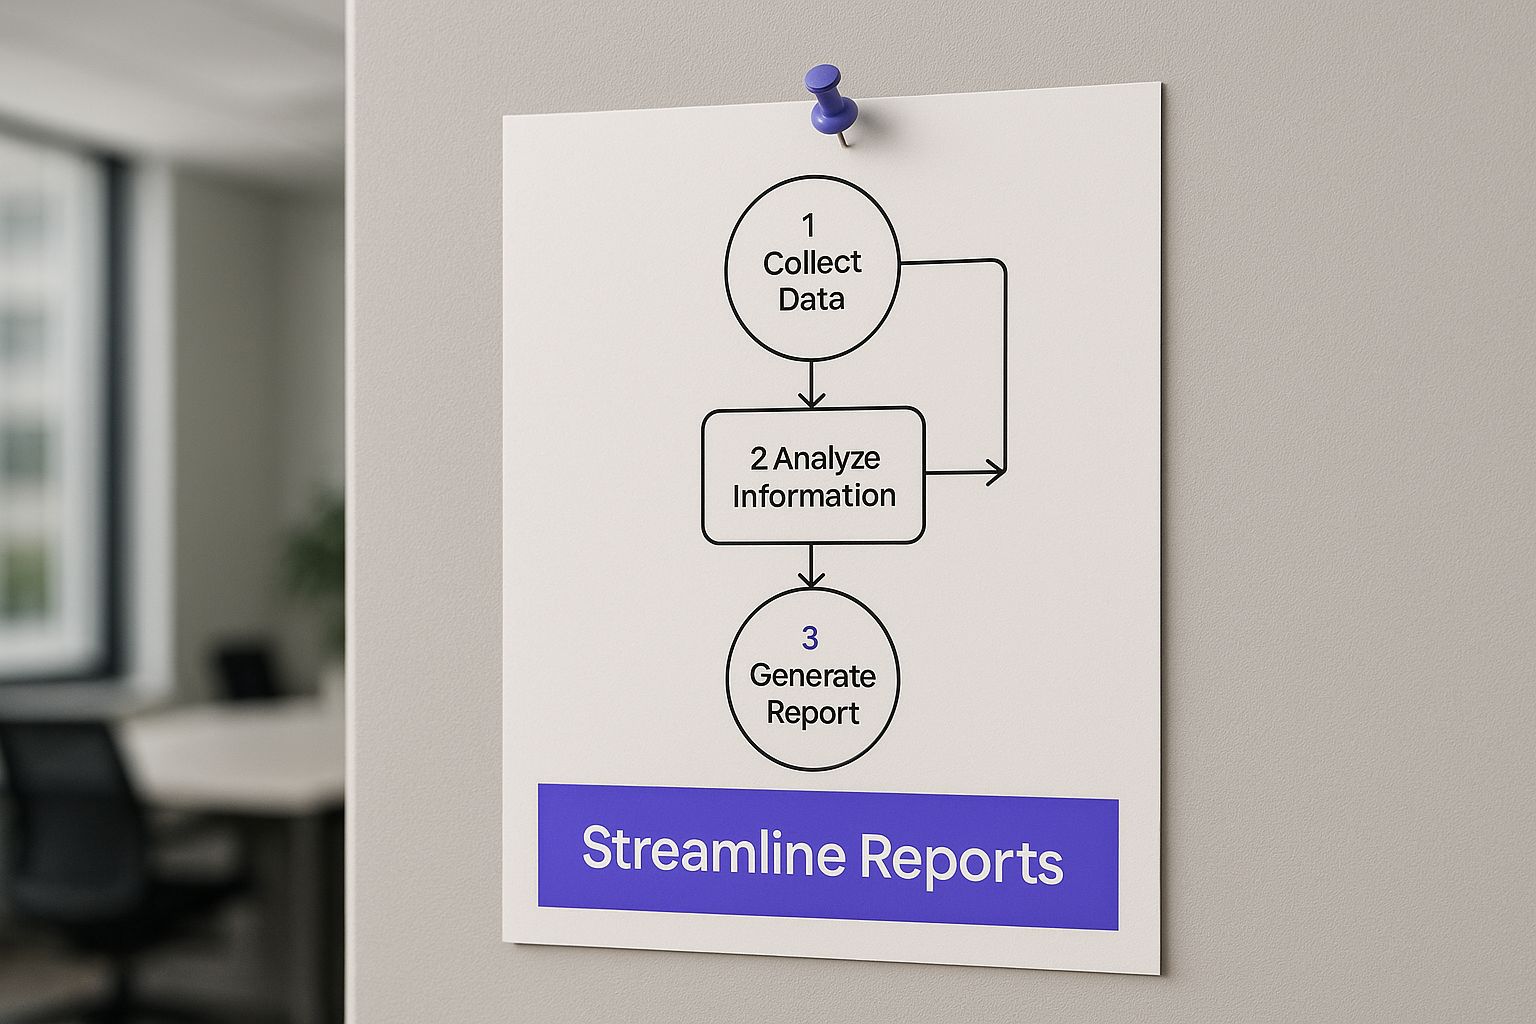
As you can see, automation forges a consistent, repeatable path from chaotic data to a polished, insightful report. Let’s break down exactly what happens at each stage.
Stage 1: Sourcing the Ingredients
It all starts with Data Collection. This is the chef gathering fresh produce, spices, and proteins from different suppliers. In the same way, your automation tool connects directly to all your data sources—your CRM, marketing platforms, databases, even those scattered spreadsheets—and pulls in the raw numbers. No more manual exports or tedious downloads. The system just goes out and fetches everything it needs on its own.
Stage 2: The Essential Meal Prep
Next up is Data Transformation. You wouldn’t just throw raw ingredients into a pot, right? Raw data is no different. It needs to be cleaned, sorted, and organized before it’s useful. During this stage, the automation tool gets the data ready by:
- Cleaning: It gets rid of duplicate entries, fixes errors, and fills in any gaps.- Structuring: The system organizes the information, filters out anything irrelevant, and combines data from different places.- Calculating: It can also run predefined calculations to create new metrics that don’t exist in the raw data, like conversion rates or customer lifetime value.
This prep work ensures the final report is built on a solid foundation of accurate, relevant information. It’s the behind-the-scenes magic that guarantees the quality of the final product.
Just as a chef’s prep work is the secret to a great dish, data transformation is the unsung hero of report automation. It’s what makes the final report not just correct, but meaningful.
Stage 3: Cooking and Plating
With all the data prepped and ready, it’s time for Report Generation. This is where the visuals come to life. The system takes the cleaned data and populates your predefined templates, automatically creating clear charts, graphs, and dashboards. You get to design the “plate” just once, and the software handles the “cooking” perfectly every single time.
Stage 4: Serving the Meal
The final step is Distribution. A fantastic meal is meant to be shared. The automation tool delivers the finished reports directly to the right people at exactly the right time. This could be a scheduled email that lands in their inbox every Monday morning, a notification in a specific Slack channel, or an update to a shared dashboard.
This entire workflow mirrors a much larger trend. The Industrial Automation market was recently valued at USD 206.33 billion and is expected to reach USD 378.57 billion in six years. This growth is fueled by the exact same need for greater efficiency and accuracy that drives report automation. If you’re curious about this trend, you can explore detailed market analysis from Grand View Research.
Choosing Your Report Automation Toolkit
Finding the right report automation tool can feel overwhelming. The market is packed with options, and it’s easy to get lost. The best way to cut through the noise is to think about where your business is right now—your team size, your budget, and how complex your data really is.
Let’s break down the solutions into three common categories. This will help you find the right fit for your specific goals without overcomplicating things.
Starting with Spreadsheet Tools
You don’t need a massive, expensive system to get started. In fact, many teams begin with the tools they already use every day: spreadsheet-based tools. Think of powerful macros in Microsoft Excel or add-ons for Google Sheets.
These are perfect for smaller teams or anyone just starting to explore automation. They handle simple, repetitive tasks beautifully, pulling data into a familiar format for basic calculations and charts. While they won’t scale forever, they’re a low-risk way to show how automation can help, paving the way for more advanced tools later. To see how these fit into the broader landscape, you can check out a guide on the top document automation software.
Graduating to Business Intelligence Platforms
As your data gets bigger and you need to ask more sophisticated questions, Business Intelligence (BI) platforms are the natural next step. Tools like Tableau or Microsoft Power BI are designed to connect to various data sources and build dynamic, interactive dashboards.
These platforms shift the focus from static, one-off reports to a living, breathing data environment. They empower users to explore trends, click into details, and find their own answers. It’s the difference between being handed a fish and learning how to fish for insights yourself.
BI tools are masters of visual storytelling, making them invaluable for any team that needs to understand the “why” behind the numbers, not just see the figures on a page.
Embracing Full-Scale Robotic Process Automation
For the most demanding and intricate reporting challenges, Robotic Process Automation (RPA) tools are the heavy hitters. Platforms like UiPath or Automation Anywhere use software “bots” to mimic human actions, allowing them to work across different applications, log into systems, and move files just like a person would.
This is more than just making reports faster. It’s about automating entire, end-to-end business processes. In fact, since 2010, the deployment of over 180,000 robots in U.S. companies has been linked to the creation of over 1.2 million new manufacturing jobs. This shows that powerful automation often drives growth and creates new opportunities rather than just eliminating tasks.
To help you decide which path is right for you, this table breaks down the main differences between these tool categories.
Comparing Report Automation Tool Categories
This table offers a quick comparison to help you match a tool category to your company’s scale, skills, and strategic goals. Tool CategoryBest ForScalabilityTechnical Skill RequiredSpreadsheet ToolsSmall teams, simple recurring tasks, and initial proof-of-concepts.Low to MediumLow (familiarity with Excel/Sheets formulas and macros).Business Intelligence (BI) PlatformsTeams needing interactive dashboards, data visualization, and self-service analytics.HighMedium (requires some data modeling and visualization skills).**Robotic Process Automation (RPA)**Large enterprises with complex, multi-system workflows and legacy applications.Very HighHigh (often requires developer or specialized RPA expertise). Ultimately, the “best” tool is the one that solves your immediate problems while giving you room to grow. Start where you are, and don’t be afraid to graduate to more powerful solutions as your reporting needs evolve.
A Practical Framework for Implementation
Getting report automation right is all about having a smart strategy, not just buying the fanciest new tool. So many teams jump in without a clear plan, only to end up with a mess of wasted time and money. This simple framework will give you a clear roadmap to roll out automation smoothly and sidestep those common headaches.
The best way to get started? Start small to win big. Don’t try to boil the ocean by automating every report at once. Instead, pick a single, high-impact report that’s a notorious time-sink. Automating this one task first lets you prove the value quickly, build momentum, and get your stakeholders genuinely excited about what’s possible.
Define Your Goals and Metrics
Before you touch any software, you have to know what winning looks like. What, exactly, are you trying to accomplish?
- Slash time spent? Maybe your goal is to cut the weekly sales report from 8 hours of manual work down to just 30 minutes.- Boost data accuracy? Is the main objective to stamp out the copy-paste errors that always seem to sneak into your monthly financial summaries?- Increase report frequency? Perhaps you need to get a critical operations report into people’s hands daily instead of monthly.
Setting clear, measurable goals gives the project a North Star. It provides direction and, just as importantly, a benchmark you can point to later to prove the whole effort was worth it.
Prioritize Data Quality and User Input
Remember the old saying, “garbage in, garbage out”? It’s especially true here. Even the most powerful automation tool on the planet can’t magically fix bad data. Before you start building, take the time to make sure your source data is clean, consistent, and reliable. This foundational work is absolutely critical for building trust in the numbers.
From day one, you need to involve the people who will actually use these reports. They’re the ones on the ground who know what information is truly valuable and how it needs to be presented. Building with them, not just for them, is what separates a report that drives decisions from one that gets ignored.
Finally, think of report automation as a living process, not a one-and-done project. Plan for ongoing maintenance and be ready to tweak things as business needs evolve. For more complex projects, solid management principles are a must. You can learn more by exploring these data science project management strategies, which offer a great foundation for any data-focused initiative.
The Future of Reporting with AI
We’re seeing a fundamental change in what report automation can do, and it’s all thanks to Artificial Intelligence (AI). For years, reports told you what happened—a look back at last quarter’s sales or last month’s web traffic. Now, AI is letting us peek into the future. It’s helping us understand what will likely happen next and, more importantly, what we should do about it. This is a massive leap from reacting to the past to proactively shaping the future.
Think of it less like a static dashboard and more like an intelligent partner. This new breed of reporting tool can spot a subtle trend in your sales data before it becomes obvious, flag unusual customer behavior that might signal a problem, or even draft a simple, plain-English summary of a deeply complex performance report. This isn’t science fiction; it’s the new frontier of business intelligence.
From Data Points to Strategic Insights
The real magic of AI in reporting is its knack for connecting the dots in ways a human analyst might not. Machine learning algorithms can chew through enormous datasets, finding faint patterns and correlations that would otherwise go unnoticed. These hidden connections are often the source of the most powerful business insights.
This capability is completely changing how companies operate. Instead of waiting for a month-end report to discover a performance dip, an AI system can alert you to the leading indicators in real time. For instance, it might detect a small but consistent drop in product usage within a specific customer group, flagging a potential churn risk long before those customers actually cancel. This gives you a crucial window to step in and fix the problem.
This shift turns your reporting system from a rearview mirror into a crystal ball. It’s no longer just about reflecting on the past but about making smarter, forward-looking decisions that keep you one step ahead.
The Growing Push for AI-Driven Efficiency
This move toward smarter automation isn’t happening in a vacuum; it’s part of a much bigger global trend. The industrial automation market, recently valued at around USD 169.82 billion, is expected to soar to USD 443.54 billion within the next ten years. This explosive growth is fueled by the same hunger for efficiency and data-driven precision that makes AI-powered reporting so compelling. You can discover more about the industrial automation market growth to get a sense of the scale of this movement.
The good news is that as AI technology matures and becomes more accessible, these advanced analytical tools are no longer just for the corporate giants. Businesses of all sizes can now create reports that deliver true, actionable intelligence. It’s quickly becoming the new standard for any organization that wants to be truly data-driven.
Common Questions About Report Automation
When teams start thinking about leaving manual reporting behind, a lot of practical questions pop up. It’s completely normal. Let’s tackle some of the most common ones head-on to clear up any confusion.
How Much Technical Skill Do I Need?
This is usually the first question people ask, and thankfully, the answer is: it really depends on the tool you pick. You’ve got options.
- For basic automation, like setting up recurring reports in Google Sheets or Excel, you just need to be comfortable with spreadsheet functions. If you know how to write a VLOOKUP, you’re already in a great spot.- For BI platforms, a little understanding of how data tables connect is useful, but these tools are built with business users in mind, not just developers. Their drag-and-drop interfaces do most of the heavy lifting.- For advanced RPA tools, you used to need specialized skills. Today, many of the best platforms are low-code or even no-code, making them much more approachable.
The bottom line? You absolutely do not need to be a developer to get started. Plenty of powerful tools are designed for anyone who’s familiar with standard business software.
The real difference between an automated report and a BI dashboard is how you engage with the data. One is like getting a curated newspaper delivered to your door—all packaged and ready. The other is like having a pass to a live newsroom where you can dig into the story yourself and ask your own questions.
Can I Automate Reports From Spreadsheets?
Yes, you can. In fact, this is one of the most popular and valuable ways to use report automation. So many businesses still rely on spreadsheets, so automation tools are built specifically to connect to them. They can automatically pull data from your Excel or Google Sheets files and feed it into a central reporting system, finally ending that painful cycle of copy-pasting.
How Can I Justify the Investment?
Getting leadership on board means speaking their language: ROI. Build a business case that clearly shows the return on investment.
Start by calculating the hours your team spends every week or month on manual reporting. Translate those hours into salary costs. That number alone is often a wake-up call. Then, emphasize the strategic benefit—shifting your team’s focus from mind-numbing data entry to high-value analysis that actually drives the business forward. Frame it as an investment in efficiency and smarter decisions, not just another software expense.
Ready to turn customer data into your most powerful asset? Statisfy uses AI to automate reporting and deliver the actionable insights you need to drive retention and growth. Learn more at Statisfy.com.