
Churn Rate vs Retention Rate Unpacked
By Abirami Venkateswaran · Customer Success Manager, Statisfy
When people talk about churn rate vs retention rate, they’re really talking about two sides of the same coin. The simplest way to think about it is that churn measures customer loss, while retention measures customer loyalty. One tells you the percentage of customers who walk away over a certain period; the other tells you the percentage who decide to stick around.
Though they are direct opposites, each metric tells a very different story about your business’s health and how happy your customers are.
Understanding the Core Metrics of Customer Loyalty
It’s easy to fall into the trap of thinking churn and retention are just simple inverses. You might picture churn as a leak in a bucket and retention as the water left inside. That’s a decent starting point, but it gets more complicated in the real world where you’re constantly pouring new customers in.
To get a real handle on these metrics, it helps to understand the nuanced difference between cancellation and churn. A customer cancelling their subscription is a single action. Churn, on the other hand, is a rate measured over time—it reveals underlying trends in customer behavior that a one-off cancellation might not.
This visual perfectly illustrates the inverse relationship in a straightforward scenario without any new customers being added.
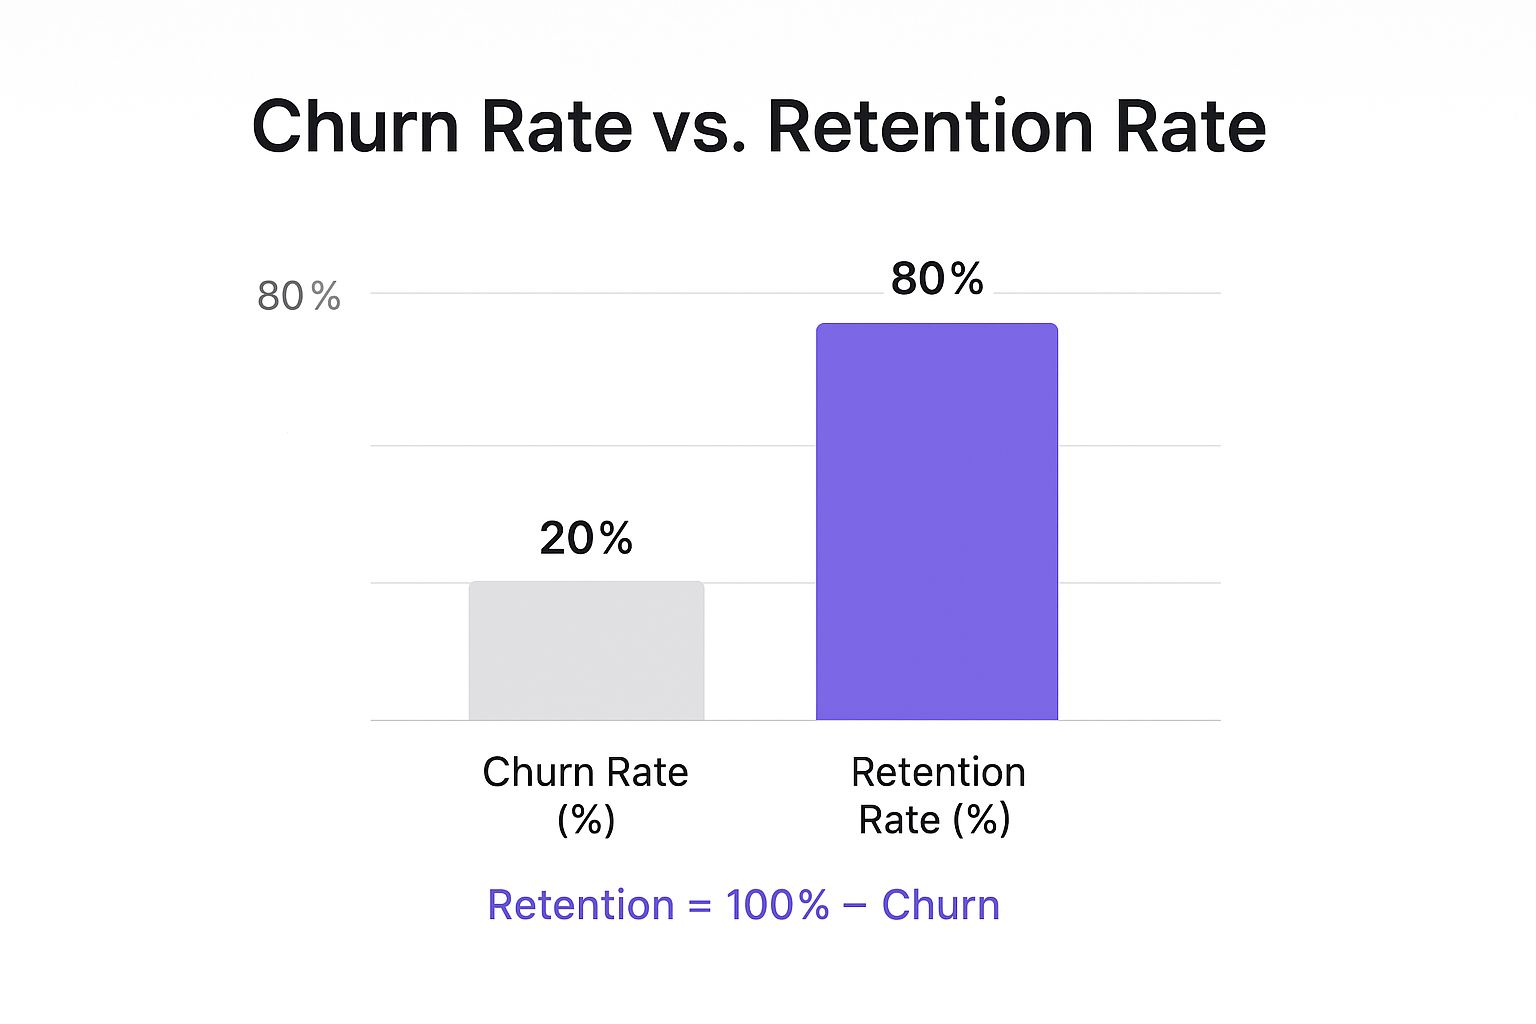
As you can see, in this controlled environment, a 20% churn rate means you have an 80% retention rate. They are perfect complements to each other.
Churn vs Retention At a Glance
So, when do you use which metric? It all comes down to what you’re trying to figure out. One is a warning sign that something’s wrong, while the other is a confirmation that you’re on the right track.
Here’s a quick breakdown to keep things clear. AspectChurn RateRetention RateFocusMeasures customer loss (attrition)Measures customer loyalty (continuity)Primary InsightIdentifies problems with product, service, or valueConfirms customer satisfaction and long-term valueBusiness GoalMinimize to as close to 0% as possibleMaximize to as close to 100% as possibleStrategic UseA diagnostic tool to find and fix weaknessesA barometer for sustainable, predictable revenue This table makes it easy to see how churn acts as a diagnostic tool, pointing to weaknesses, whereas retention acts as a barometer, measuring your business’s stability and revenue predictability.
Industry context is everything here. Financial services, for instance, struggle with high turnover, seeing churn rates hover around 25%. That’s a stark contrast to digital media at 6.5% or software services at just 3.5%, where the entire business model is often built on fostering long-term relationships. In fact, poor customer retention costs U.S. businesses a staggering $35.3 billion every year.
Getting Your Churn and Retention Rate Calculations Right

Any solid business strategy is built on good data. When it comes to understanding customer loyalty, knowing how to properly calculate churn and retention is non-negotiable. While the ideas behind them feel simple, small mistakes in the formulas can lead to big misinterpretations.
Getting these calculations right from the start means you can trust your numbers and make decisions with confidence. The basic formulas for both customer churn rate and customer retention rate give you a clear, powerful snapshot of how your customer base is changing over time.
Let’s walk through how to do it.
The Core Formulas
To figure out your churn rate, you just need two pieces of information: how many customers you lost during a specific period and how many you had when that period began. The result shows you what percentage of your customer base you’ve lost.
Customer Churn Rate Formula:
(Customers Lost During Period / Customers at Start of Period) x 100
For example, if you had 500 customers at the beginning of the quarter and 25 of them left, your churn rate for that quarter would be 5%. The math is simply (25 / 500) x 100.
Retention, on the flip side, measures the customers who stuck around. This formula is a little more involved because you have to be careful not to include any new customers you gained during the period. They weren’t there to be “retained” in the first place.
Customer Retention Rate Formula:
((Customers at End of Period - New Customers Acquired) / Customers at Start of Period) x 100
Let’s say you started with 500 customers, signed up 50 new ones, and ended the quarter with a total of 525. Your retention rate calculation would be ((525 - 50) / 500) x 100, which works out to 95%.
Why Definitions and Time Frames Are Crucial
Knowing the formulas is just the first step. How you define your terms and the time frame you choose are just as critical for getting a clear picture.
One of the biggest mistakes I see is a lack of consistency. You have to standardize what an “active customer” means and stick to a consistent time frame for all your reporting. Otherwise, you’re not comparing apples to apples.
The right measurement period really depends on your business model:
- Monthly: This is the standard for most SaaS companies with monthly billing. It gives you quick feedback on recent product updates or marketing efforts.- Quarterly: Looking at your numbers quarterly helps smooth out any random monthly spikes or dips. It’s great for businesses with longer sales cycles or for anyone trying to get a broader, more strategic view.- Annually: Best for enterprise businesses with long-term contracts. An annual calculation really shines a light on your company’s long-term health and customer loyalty.
Defining an “active” user is just as important. Does it mean someone who logs in, uses a specific feature, or is a paying subscriber? For an e-commerce shop, an active customer might be someone who bought something in the last 90 days. Whatever you decide, this definition directly affects your customer counts. Pick one that makes sense for your business, document it, and stick with it. Any inconsistency will throw off your churn vs. retention analysis and make it nearly impossible to identify real trends.
What Each Metric Reveals About Your Business Strategy
Beyond the formulas, churn and retention rates tell two very different stories about your business. One is a flashing red light on your dashboard, signaling immediate problems. The other is a measure of your long-term health, showing you’ve built something that lasts.
Knowing how to read the story behind each number is what separates reactive tactics from smart, forward-thinking strategy. A high churn rate isn’t just a number; it’s a direct signal that something is fundamentally misaligned—be it your product, your pricing, or the customer experience you’re delivering.
Churn Rate: The Diagnostic Tool
Think of your churn rate as an early-warning system. It’s the metric that points directly to friction and dissatisfaction, forcing you to ask the hard questions. Is our onboarding process a confusing mess? Does the product actually live up to the marketing hype? Is the price tag completely out of sync with the value customers feel they’re getting?
When left unchecked, churn creates a brutal cycle. You’re forced to pour more and more money into acquiring new customers just to tread water, which sends your customer acquisition cost (CAC) through the roof. This “leaky bucket” doesn’t just drain your budget; over time, it damages your brand’s reputation and erodes trust in the market.
Retention Rate: The Barometer of Value
While churn exposes your weak spots, retention rate is all about your strengths. This is the ultimate indicator of customer loyalty and the real, long-term value you’re providing. A high retention rate is proof that you’ve found product-market fit and are delivering an experience that makes customers want to stick around.
Churn reveals where your business is bleeding; retention shows where its heart is strongest.
This stability is the bedrock of predictable revenue. We all know it’s cheaper to keep an existing customer than to find a new one, but the benefits run deeper. Loyal customers create fertile ground for growth, making it much easier to upsell and cross-sell because you’ve already earned their trust.
Take a SaaS company with a 95% retention rate. That business can forecast its revenue with confidence and make strategic investments in growth, whether that means expanding to new markets or doubling down on product development.
Ultimately, when you compare churn rate vs retention rate, you’re looking at the past versus the future. Churn forces you to react to past mistakes, while retention empowers you to build on your successes. A truly solid strategy requires a close watch on both. This is where a platform like Statisfy comes in, helping you translate raw customer data into clear insights. It makes it easier to see exactly what drives both churn and retention, so you can fix what’s broken and build on what’s working.
Comparing Churn and Retention Benchmarks Across Industries

It’s tempting to look at your churn and retention metrics in isolation, but that’s like trying to navigate without a map. To really know if your numbers are good, bad, or just average, you have to see how they stack up against your industry peers.
What counts as a stellar retention rate for a SaaS business could spell trouble for an e-commerce store. These variations aren’t accidental; they’re shaped by the very fabric of an industry—things like contract lengths, the hassle of switching to a competitor, and how crowded the market is. Knowing where you stand is the first step to setting goals that make sense.
High-Retention vs. High-Churn Industries
When you dig into the data on churn rate vs. retention rate, you start to see distinct patterns. Some industries are just naturally stickier than others, and understanding why is key to building a strategy that fits your reality.
Take the media and professional services sectors, for example. They often lead the pack with retention rates as high as 84%. This isn’t surprising when you think about it. Loyalty is built on specialized expertise, long-term contracts, and services that are deeply woven into a client’s workflow. The cost and effort of switching are just too high.
Then you have the other side of the coin: industries like hospitality, travel, and restaurants, where retention often hovers around 55%. Here, the market is defined by intense competition and low switching costs. Customers often choose based on price or convenience, not deep-rooted brand loyalty. It’s a completely different ballgame. If you want to dive deeper, you can explore more about these industry-specific retention figures.
The biggest takeaway here? Your industry sets the rules of the game. Comparing your SaaS company’s churn to a local restaurant’s is an apples-to-oranges comparison that won’t get you anywhere. You need to benchmark against direct competitors and businesses with similar models to get a true read on your performance.
A Comparative Look at Industry Benchmarks
To see just how much these benchmarks can vary, it helps to look at the numbers side-by-side. The following table provides a snapshot of average annual rates across several major sectors, highlighting just how different “normal” can look.
Industry Benchmark Comparison Churn vs Retention
IndustryAverage Annual Churn Rate (%)Average Annual Retention Rate (%)Media & Pro Services**16%****84%**SaaS (B2B)**28%****72%**Retail (E-commerce)**37%****63%Hospitality & Travel45%**55% These figures aren’t just numbers; they tell a strategic story. A professional services firm with high retention should focus on nurturing those deep relationships. A retail brand, on the other hand, needs to master re-engagement to counteract its naturally higher churn.
By grounding your goals in these benchmarks, you can move past generic advice and develop strategies that are proven to work in your specific corner of the market.
Practical Strategies to Improve Your Key Metrics
Knowing the difference between your churn rate vs retention rate is one thing, but the real work begins when you use that knowledge to make meaningful changes. The best approach isn’t about focusing on just one metric; it’s about creating a strategy that both reduces churn and boosts retention at the same time. Think of it as plugging leaks in a bucket while also making the bucket itself more valuable to hold onto.
This coordinated effort is what drives sustainable, long-term growth.
Tactics to Systematically Reduce Churn
Getting your churn rate down requires a proactive mindset. You have to get ahead of the problem and solve issues before a customer even thinks about canceling. The most effective way to do this is by spotting customers who are at risk and stepping in with timely, valuable help.
Here are a few proven tactics for reducing churn:
- Proactive Customer Support: Don’t just sit back and wait for the support tickets to roll in. Use your tools to see who’s struggling with a feature or whose activity has dropped off. A quick, helpful email or in-app message can make all the difference.- Analyzing Exit Feedback: When a customer cancels, the reason they give you is pure gold. Make exit surveys mandatory to capture this data. Over time, you’ll see patterns emerge that point to specific gaps in your product, pricing problems, or service failures.- Identifying At-Risk Behavior: Keep a close eye on the leading indicators of churn. These are often subtle shifts in behavior like fewer logins, ignoring key features, or falling behind on payments. Platforms like Statisfy are built to automate this kind of monitoring, flagging at-risk accounts so your team can intervene right away.
The goal isn’t just to prevent a single cancellation. It’s to understand why it was happening and fix the root cause. Every piece of feedback from a churning customer is a roadmap for improving the experience for everyone else.
It’s also smart to know where you stand. Industry benchmarks can provide crucial context. For instance, professional services firms see an average churn rate of around 27%, while telecommunications companies recently experienced a spike to 31%. These numbers show that every industry has its own unique pressures. You can see a full breakdown of industry churn rates to see how you compare.
Strategies to Actively Boost Retention
If reducing churn is playing defense, then boosting retention is your offense. This is all about creating an experience so valuable and engaging that leaving feels like a major step down for your customers. You’re aiming to build genuine loyalty that turns buyers into vocal advocates for your brand.
To really move the needle on your retention rate, concentrate on building relationships and delivering undeniable value:
- Personalized Communication: Ditch the one-size-fits-all email blasts. Segment your customers and talk to them about what they care about. Send them tips, content, and offers based on how they actually use your product.- Smart Upselling and Cross-selling: Your most loyal customers are often ready for more. Introduce them to premium features or other products that solve their next challenge. This not only increases their investment in your ecosystem but also delivers more value directly to them.- Building a Community: Give your customers a place to connect with each other and with your team. This could be a forum, a dedicated Slack channel, or exclusive user groups. A strong community creates a powerful sense of belonging that goes far beyond just a product.
Putting these ideas into practice requires a real commitment to understanding what your customers are trying to achieve. For a more comprehensive look at this, check out these customer retention best practices. When you actively work on both sides of this coin—reducing churn and increasing retention—you build a powerful, durable engine for business growth.
When to Focus on Churn Reduction vs. Retention Growth

The classic churn rate vs. retention rate dilemma isn’t about choosing one metric to rule them all. It’s really about timing and focus. Where you pour your energy—either plugging leaks in a leaky bucket or building a deeper well—depends entirely on where your business is in its journey.
Making the right call means taking a hard, honest look at your current situation. A fledgling startup struggling to find its footing has fundamentally different challenges than an established market leader aiming to deepen its customer relationships. Let’s break down how to decide.
The Startup Priority: Churn Reduction
If you’re an early-stage company, a high churn rate is a five-alarm fire. It’s a clear signal that something is broken. Trying to boost retention before you’ve nailed your core offering is like trying to decorate a house that’s still missing a roof. The absolute priority is figuring out why people are heading for the exits.
Think of this as your diagnostic phase. You need to get to the bottom of some tough questions:
- Does our product actually solve the problem we claim it does?- Are we losing people during onboarding because it’s confusing or overwhelming?- Is there a massive disconnect between our price and the value customers feel they’re getting?
For a startup, churn is more than a number—it’s raw, unfiltered feedback from the very market you’re trying to win. Obsessing over churn reduction at this stage forces you to refine your product until it’s something people genuinely can’t live without. That’s the foundation for all future growth.
The Mature Company Priority: Retention Growth
Once your business has found its footing and your churn rate has stabilized to a predictable, manageable level, it’s time to shift your perspective. For established companies, the most significant growth levers are often found within your existing customer base.
This is when the conversation moves from preventing loss to actively creating more value. Your strategy becomes less about defense and more about offense. You start focusing your efforts on initiatives like:
- Expansion Revenue: How can we encourage our happiest customers to upgrade or adopt new features? This is where upselling and cross-selling become your best friends.- Customer Advocacy: How can we empower our loyal fans to become our best salespeople? Think referral programs and case studies.- Community Building: How do we create a moat around our product by fostering a network that adds value beyond the software itself? This builds loyalty and makes it harder for customers to leave.
At this stage, you’re moving beyond simple damage control and into the realm of cultivating long-term, profitable relationships. Whether you’re stamping out churn or driving retention, a tool like Statisfy can give you the clear data you need to invest your resources wisely and make the right strategic moves.
Frequently Asked Questions
When you start digging into churn and retention, a few questions always seem to pop up. They’re common for a reason—the answers are critical for getting your reporting right and building a strategy that actually works.
Can Churn and Retention Rates Exceed 100%?
It can definitely feel like you’ve made a mistake in your spreadsheet, but yes, your churn and retention rates can sometimes add up to more than 100%. This isn’t an error; it’s a quirk that happens when new customers are factored into the mix.
Retention is calculated based on the customers you started the period with. Rapid growth from new sign-ups won’t change that starting number, but it will change your total customer count. This is why a simple inverse calculation (100% - Churn = Retention) can get skewed and lead to some confusing results.
What Is a Good Churn Rate for a SaaS Business?
There’s no magic number here. A “good” churn rate is completely dependent on your specific market, business model, and how long you’ve been around.
That said, a generally accepted benchmark for established SaaS companies that serve small to medium-sized businesses is a 5-7% annual churn rate. If you’re an early-stage startup still trying to nail your product-market fit, you can expect to see higher rates. The key is to consistently push that number down as your business matures.
Remember, context is everything. A 5% churn rate might be fantastic for one company but a serious red flag for another, especially if they have a different customer base or average contract value.
Should I Track Customer Churn or Revenue Churn?
Honestly, you need to track both. They paint two very different, but equally important, pictures of your business’s health.
Customer Churn (or Logo Churn): This tells you the percentage of individual customers who leave. It’s a straightforward measure of your product’s overall satisfaction and stickiness. Are people finding value and sticking around? This metric tells you.
Revenue Churn (or MRR Churn): This tracks the actual monthly recurring revenue you’ve lost. For any subscription business, this is arguably the more critical vital sign. It accounts not just for cancellations, but also for downgrades and, most importantly, the financial impact of losing high-value accounts.
Think about it: losing ten small, low-paying customers might barely make a dent compared to losing a single enterprise client. Focusing on revenue churn helps you direct your energy toward where the financial risk is highest.
Getting a handle on these metrics is the foundation of sustainable growth. Statisfy offers AI-powered insights that help you monitor customer health, anticipate churn before it happens, and pinpoint your best retention opportunities automatically. Transform raw data into clear, actionable strategies by learning more at Statisfy’s official website.