
7 Essential Client Success Metrics to Track in 2025
By Abirami Venkateswaran · Customer Success Manager, Statisfy
Beyond Satisfaction: Why Your Business Needs These Client Success Metrics
In today’s competitive landscape, simply having satisfied customers isn’t enough. Sustainable growth is built on proactively fostering client success, which means ensuring clients consistently achieve their desired outcomes using your product or service. This requires moving beyond gut feelings and implementing a robust framework of measurement. This article provides a comprehensive roundup of the most critical client success metrics every business must track to thrive. We will move beyond basic definitions to provide you with the tools necessary for genuine improvement.
This listicle will dive deep into each key metric, offering not just clear definitions, but also:
- Precise calculation methods- Actionable strategies for improvement- Industry benchmarks to see how you stack up
Understanding and optimizing these key indicators will empower your team to reduce churn, increase lifetime value, and build a loyal customer base that fuels your growth engine. We’ll explore how modern platforms are revolutionizing how teams track these metrics, using AI to automate data collection and provide actionable insights. This allows you to focus on what truly matters: building strong client relationships and driving tangible results for your customers.
1. Net Promoter Score (NPS)
Net Promoter Score (NPS) stands as one of the most widely adopted client success metrics, designed to gauge customer loyalty with a single, powerful question: “On a scale of 0-10, how likely are you to recommend our company/product/service to a friend or colleague?” This metric’s elegance lies in its simplicity, providing a clear, high-level snapshot of customer sentiment that is easy for entire organizations to understand and rally behind.
The power of NPS comes from how it categorizes respondents, turning a simple score into actionable intelligence. Customers are segmented based on their answer, allowing you to understand the composition of your user base.
Understanding the NPS Calculation
The calculation segments your customers into three distinct groups:
- Promoters (9-10): These are your most enthusiastic and loyal customers. They are highly satisfied and act as brand advocates, fueling growth through positive word-of-mouth.- Passives (7-8): These customers are satisfied but unenthusiastic. They are vulnerable to competitive offerings and are not actively promoting your brand.- Detractors (0-6): These are unhappy customers who can damage your brand and impede growth through negative reviews and feedback.
The following visual breaks down how these groups contribute to your final score.
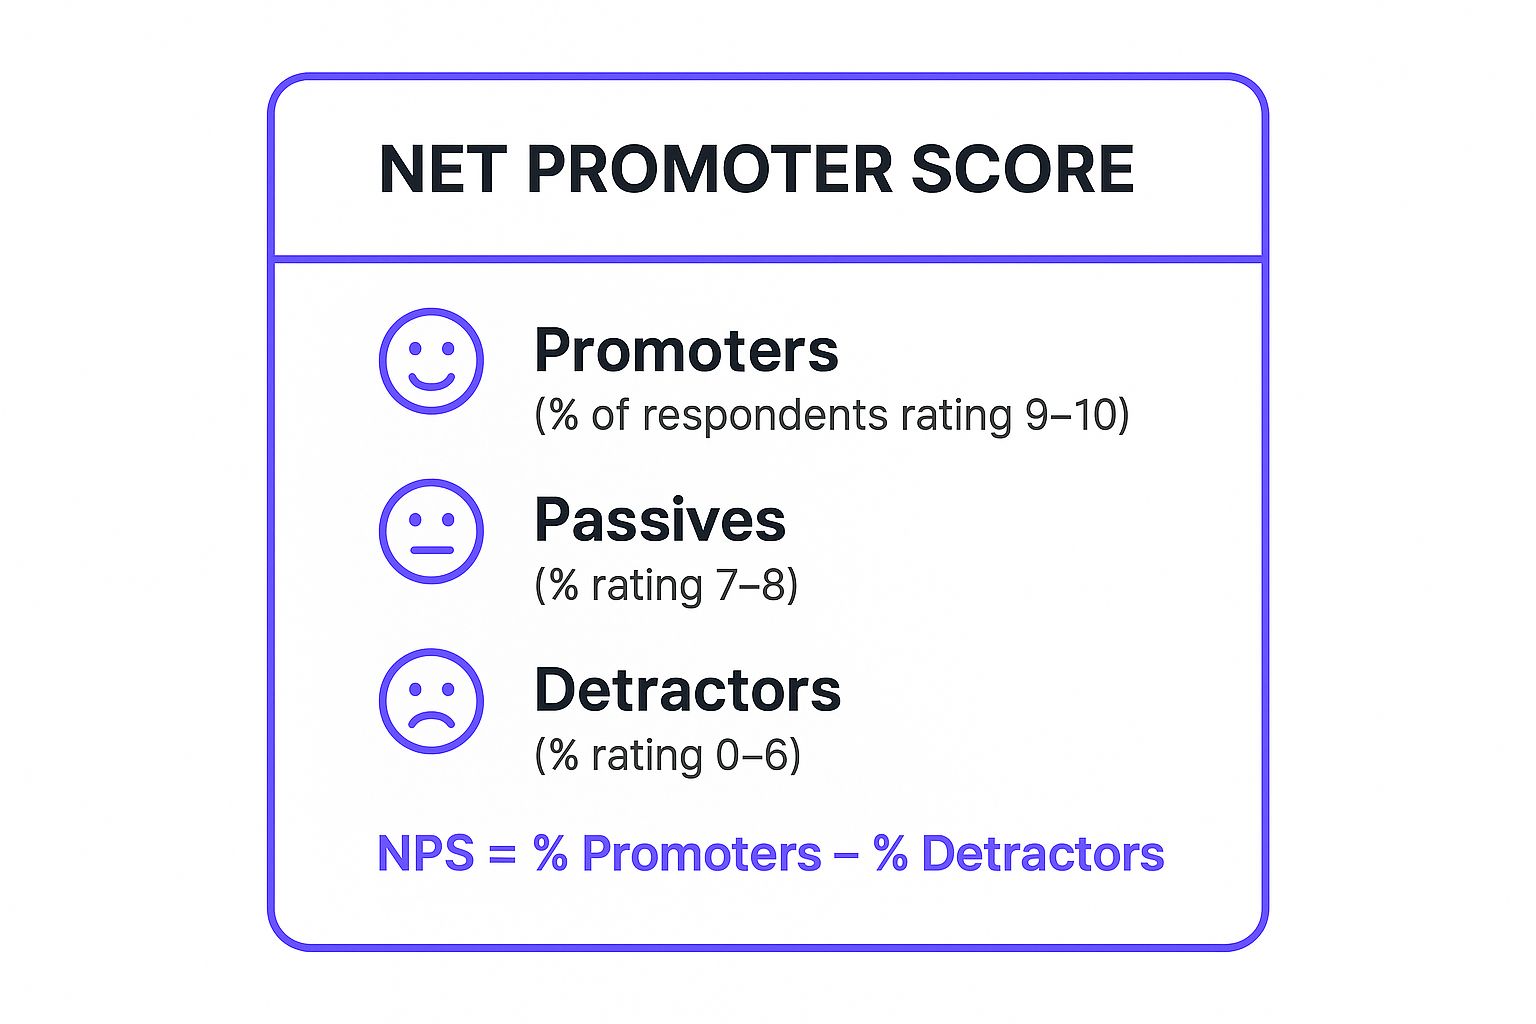
As the infographic illustrates, your final NPS score is the difference between your percentage of Promoters and Detractors, providing a single number that reflects your company’s customer loyalty.
Actionable Insights for Implementation
To make NPS one of your most effective client success metrics, move beyond just tracking the score. Always include an open-ended follow-up question, such as “What is the primary reason for your score?” This qualitative feedback is where the real value lies. Segment your results by customer persona, product line, or stage in the customer journey to pinpoint specific strengths and weaknesses.
Crucially, you must “close the loop.” Implement a system to have your team follow up with Detractors within 24-48 hours to resolve their issues and show you value their feedback. Similarly, engage with Promoters to thank them and explore opportunities for testimonials or case studies. Companies like Southwest Airlines use this feedback loop not just to fix individual problems but to drive large-scale operational improvements, demonstrating the strategic potential of a well-executed NPS program.
2. Customer Lifetime Value (CLV/LTV)
Customer Lifetime Value (CLV or LTV) is a predictive metric that shifts the focus from short-term transactions to long-term relationship profitability. It forecasts the total net profit a company can expect to generate from a single customer throughout their entire journey with the brand. This powerful metric is fundamental to strategic decision-making, helping businesses determine appropriate spending on customer acquisition and retention efforts by quantifying the long-term financial worth of each client relationship.
The true strength of CLV as a client success metric lies in its ability to inform resource allocation. By understanding which customer segments are most valuable over time, you can prioritize efforts and investments to maximize return and foster sustainable growth.

Understanding the CLV Calculation
Calculating CLV can range from simple historical models to complex predictive formulas. A basic approach involves multiplying the average purchase value by the average purchase frequency and the average customer lifespan. More advanced models incorporate variables like profit margin and churn rate for greater accuracy. The core components typically include:
- Average Purchase Value: The average amount a customer spends in a single transaction.- Purchase Frequency: How often a customer makes a purchase within a specific time period.- Customer Lifespan: The average length of time a customer continues to buy from your company.
As the image suggests, these factors combine to project the total revenue a customer will generate, providing a clear financial target for your client success initiatives.
Actionable Insights for Implementation
To effectively integrate CLV into your strategy, you must move beyond a single, company-wide number. Segment your CLV by acquisition channel, customer persona, or initial product purchased. This analysis reveals which channels bring in the most profitable customers, not just the most customers. For instance, SaaS companies like Salesforce use CLV to optimize pricing tiers and guide upsell strategies toward high-value accounts.
Crucially, compare CLV to your Customer Acquisition Cost (CAC). A healthy business model typically features a CLV that is at least three times its CAC. Regularly update your CLV calculations with fresh data and use cohort analysis to track how its value changes over time for different customer groups. Starbucks, for example, leverages CLV insights to justify investments in its loyalty program, knowing that even small increases in purchase frequency and retention dramatically boost long-term profitability.
3. Customer Satisfaction Score (CSAT)
Customer Satisfaction Score (CSAT) is a foundational client success metric used to measure customer happiness with a specific product, service, or interaction. It directly answers the question, “How satisfied were you with your experience?” CSAT’s strength is its transactional nature, providing immediate, in-the-moment feedback on distinct touchpoints within the customer journey. This makes it an invaluable tool for pinpointing and improving individual processes.
Unlike broader loyalty metrics, CSAT is focused and tactical. It allows businesses to zoom in on specific interactions, such as the resolution of a support ticket, the completion of a purchase, or the onboarding process, to gauge performance and identify friction points.
Understanding the CSAT Calculation
The calculation for CSAT is straightforward and typically involves asking customers to rate their satisfaction on a scale, often 1 to 5.
- Satisfied Customers (4-5): These are customers who had a positive experience.- Neutral Customers (3): These customers were neither satisfied nor dissatisfied.- Dissatisfied Customers (1-2): These are unhappy customers who encountered issues.
Your CSAT score is the percentage of satisfied customers out of the total number of respondents. The formula is: (Number of Satisfied Customers / Total Number of Survey Responses) x 100. For example, if 150 out of 200 respondents give a score of 4 or 5, your CSAT score is 75%. This simple percentage is easy for support teams and product managers to track and act upon.
Actionable Insights for Implementation
To effectively use CSAT as one of your core client success metrics, timing and context are everything. The key is to deploy the survey immediately after the relevant interaction has concluded, while the experience is still fresh in the customer’s mind. For instance, Uber prompts for a rating right after a ride ends, and software companies often trigger a CSAT survey the moment a support ticket is closed.
Keep the survey brief, ideally limited to the rating question and a single open-ended follow-up like, “Could you tell us a bit more about why you chose that score?” This qualitative data provides crucial context behind the number. To operationalize this feedback, set up automated alerts for your team whenever a low score is received. This enables swift follow-up to address the customer’s issue, potentially turning a negative experience into a positive one and demonstrating your company’s commitment to satisfaction.
4. Customer Effort Score (CES)
Customer Effort Score (CES) is a powerful transactional metric that measures the ease of a customer’s experience with a company. It operates on a simple but critical principle: customers are more loyal to products and services that are easy to use. Instead of gauging general satisfaction, CES pinpoints the amount of effort a customer had to expend to get an issue resolved, a request fulfilled, or a purchase completed. This focus on “effortlessness” makes it one of the most predictive client success metrics for future purchasing behavior and loyalty.
The core of CES is a direct question posed after a specific interaction, such as, “To what extent do you agree with the following statement: The company made it easy for me to handle my issue?” Customers typically respond on a 1-7 scale, from “Strongly Disagree” to “Strongly Agree.” A high average score indicates a low-effort, positive experience.
Understanding the CES Calculation
Calculating CES is straightforward. It is typically the average of all the scores received. For a 7-point scale, you would sum up all the individual scores and divide by the number of responses. A higher score signifies a lower-effort experience, which is the desired outcome. The goal is to identify and eliminate friction points within the customer journey.
- Low Effort (High Score 5-7): Indicates a smooth, seamless interaction. These customers are significantly more likely to remain loyal, increase their spending, and speak positively about your brand.- High Effort (Low Score 1-4): Signals friction, frustration, and potential churn. These experiences are where loyalty is broken and customers begin looking for alternatives.
Companies like Zappos use CES to ensure their legendary customer service isn’t just friendly but also efficient. They track the effort involved in making a return, knowing that an easy return process often leads to a future purchase.
Actionable Insights for Implementation
To effectively integrate CES into your client success metrics, timing and context are everything. Deploy the CES survey immediately after a specific touchpoint, such as post-support-ticket resolution, after a new feature has been used for the first time, or following checkout. This provides immediate, relevant feedback tied to a single process.
Focus on operationalizing the feedback. If a software company sees a low CES score for its new onboarding flow, it’s a clear signal to simplify the user interface or add more guided tutorials. Combine CES data with operational metrics like ticket resolution time or the number of transfers during a support call to get a complete picture. Most importantly, train your teams to be proactive in reducing effort, empowering them to resolve issues in a single interaction whenever possible. This shift from measuring satisfaction to measuring effort can fundamentally improve customer retention.
5. Churn Rate
Churn Rate, often called customer attrition, is a fundamental client success metric that measures the percentage of customers who stop doing business with a company over a specific period. It is a direct and often sobering indicator of customer health and product value. While growth metrics are exciting, a high churn rate can silently undermine even the most successful acquisition efforts, making it a critical vital sign for any subscription-based or recurring revenue business.
The power of the churn rate lies in its brutal honesty. It signals a failure to deliver on your brand promise, meet customer expectations, or demonstrate ongoing value. Companies like Netflix and Dropbox obsessively track this metric not just as a historical number, but as a leading indicator of market fit, competitive pressure, and customer satisfaction, allowing them to proactively adjust their strategies.
Understanding the Churn Calculation
Calculating churn seems simple, but its nuances provide deeper insights. At its core, it’s the number of customers lost during a period divided by the total number of customers at the start of that period. However, a comprehensive view requires looking at it from two angles:
- Customer Churn: This is the percentage of individual customers or accounts that you lose. It tells you how many clients are leaving. For example, if you start the month with 500 customers and lose 25, your customer churn rate is 5%.- Revenue Churn (MRR Churn): This is the percentage of monthly recurring revenue (MRR) lost from existing customers. This is arguably more critical, as losing a few high-value customers can be more damaging than losing many low-value ones.
Tracking both provides a complete picture of attrition. High customer churn with low revenue churn might indicate issues with your lowest-tier plans, while the reverse signals a problem with your most valuable accounts.
Actionable Insights for Implementation
To transform churn from a lagging indicator into a proactive tool, you must dig deeper than the overall percentage. Start by segmenting your churn data by customer cohort, acquisition channel, or pricing plan to identify patterns. Are customers who signed up during a specific marketing campaign churning faster? Is one particular plan underperforming?
Implement an early warning system by tracking leading indicators of churn. This could include a decline in product usage, a drop in feature adoption, or an increase in support tickets from a specific account. When a customer does decide to leave, conduct an exit interview or send a survey to understand the “why.” This qualitative feedback is gold, providing direct insight into product gaps, service failures, or competitive disadvantages. By systematically analyzing these reasons, you can address the root causes of attrition and build a more resilient, customer-centric business.
6. First Call Resolution (FCR)
First Call Resolution (FCR) is a critical service-level client success metric that measures the ability to resolve a customer’s issue during the very first interaction. It calculates the percentage of inquiries resolved completely on the first attempt, eliminating the need for follow-up calls, emails, or further support tickets. This metric is a powerful indicator of both operational efficiency and customer satisfaction, as it directly reflects how effectively your team can deliver solutions without creating additional customer effort.
The value of FCR lies in its dual impact. For the customer, a high FCR rate means a quick, painless resolution and a positive brand experience. For the business, it translates to lower operational costs, improved agent productivity, and a significant reduction in customer frustration, which is a leading cause of churn.
Understanding FCR Calculation and Impact
Calculating FCR is straightforward, though definitions can vary slightly between organizations. The most common formula is:
- FCR Rate = (Total Number of Issues Resolved on First Contact / Total Number of Inquiries) x 100
What constitutes a “resolved” issue is key. The best practice is to confirm resolution directly with the customer at the end of the interaction. For instance, a telecommunications provider like Verizon tracks FCR not just for technical outages but also for billing questions, aiming for a swift, confirmed resolution that prevents repeat calls on the same issue. Similarly, Dell’s technical support teams strive for high FCR rates, knowing that solving a problem on the first call dramatically increases customer loyalty.
Actionable Insights for Implementation
To make FCR a truly effective metric, you must focus on empowering your frontline teams. Equip them with a comprehensive and easily searchable knowledge base that provides immediate access to accurate information. Give agents the authority to handle a wider range of issues, such as processing refunds or making account adjustments, without needing to escalate.
Tracking FCR by issue type is also essential. This helps identify complex problems that require better documentation or specific agent training. To streamline service operations and significantly improve metrics like First Call Resolution, it’s beneficial to understand how AI can empower customer support by providing agents with real-time guidance and automated knowledge retrieval. Finally, balance your FCR targets with quality. Never pressure agents to close tickets prematurely just to hit a number; always validate the resolution with the customer to ensure the problem is truly solved.
7. Monthly Active Users (MAU) / Daily Active Users (DAU)
Monthly Active Users (MAU) and Daily Active Users (DAU) are fundamental engagement metrics that quantify the number of unique users interacting with your product or platform within a given month or day. For digital products, SaaS platforms, and mobile apps, these figures are the lifeblood of client success, serving as a direct proxy for product value and adoption. They provide a clear, high-level pulse on whether your user base is consistently deriving value from your service.
The power of MAU and DAU lies in their ability to signal product stickiness and overall platform health. A growing number of active users indicates healthy acquisition and retention, while a stagnant or declining trend can be an early warning sign of disengagement, potential churn, or competitive threats.
Understanding the MAU/DAU Calculation
The calculation for these metrics requires a precise definition of what constitutes an “active” user for your specific business. This is a critical first step.
- Daily Active Users (DAU): The total number of unique users who perform a meaningful action within your product on a given day.- Monthly Active Users (MAU): The total number of unique users who perform a meaningful action within your product over a 30-day period.
A key derivative metric is the DAU/MAU ratio, often called the “stickiness ratio.” This is calculated by dividing your DAU by your MAU. A higher ratio suggests that a larger percentage of your monthly users are returning on a daily basis, indicating strong, habitual engagement. For example, a platform like Facebook, which thrives on daily interaction, aims for a high DAU/MAU ratio, while an accounting software used primarily at month-end might naturally have a lower one.
Actionable Insights for Implementation
To transform MAU and DAU into truly effective client success metrics, you must move beyond simply tracking the headline numbers. First, establish a very specific, consistent definition of “active.” Is it a simple login, or does it require a key value-driving action, like creating a report or sending a message? This definition must be standardized across your organization.
Next, analyze trends rather than static numbers. Is your MAU growing month-over-month? Is your DAU/MAU ratio improving? Segment these metrics by user cohorts, subscription plans, or key features to identify which parts of your product are driving the most engagement and which customer segments are at risk. For instance, a SaaS company might discover that users who engage with a specific new feature have a 20% higher DAU/MAU ratio, providing a clear signal to promote that feature more heavily during onboarding to improve overall client success.
Client Success Metrics Comparison Overview
MetricImplementation Complexity 🔄Resource Requirements ⚡Expected Outcomes 📊Ideal Use Cases 💡Key Advantages ⭐Net Promoter Score (NPS)Low - single question surveyLow - simple surveysMeasures customer loyalty and likelihood to recommendBroad customer loyalty measurementEasy to implement; strong growth predictorCustomer Lifetime Value (CLV)High - complex data integrationHigh - multiple data sourcesPredicts total revenue per customer over timeLong-term revenue forecasting and marketing spendJustifies acquisition cost; identifies segmentsCustomer Satisfaction Score (CSAT)Low - simple surveysLow - event-triggered surveysMeasures immediate satisfaction with interactionsPost-interaction feedback and service evaluationQuick feedback; actionable for improvementsCustomer Effort Score (CES)Medium - focused surveysMedium - targeted question designAssesses ease of customer issue resolutionReducing friction in customer journeysStrong loyalty predictor; less emotional biasChurn RateMedium - data tracking over timeMedium - requires cohort analysisIndicates customer attrition rateSubscription and recurring revenue businessesDirect retention indicator; drives improvementFirst Call Resolution (FCR)Medium - multi-channel trackingMedium - agent and issue trackingMeasures issue resolution efficiency on first contactCustomer service operationsEnhances satisfaction; reduces costsMAU / DAUHigh - user tracking systemsHigh - requires real-time dataTracks user engagement and product stickinessDigital products and platformsIndustry standard for engagement; growth insight
From Data to Decisions: Activating Your Client Success Strategy
We’ve explored seven foundational client success metrics that serve as the vital signs of your customer relationships. From the loyalty pulse-check of Net Promoter Score (NPS) and the long-term financial health indicated by Customer Lifetime Value (CLV), to the immediate satisfaction captured by CSAT and the operational efficiency measured by First Call Resolution (FCR), each metric provides a distinct and valuable perspective.
However, the true power of these metrics is not found in isolation. Viewing them individually is like looking at a single puzzle piece. The complete picture only emerges when you synthesize this data, transforming disparate numbers into a cohesive narrative about the customer journey. The goal is to move beyond simply tracking data points and start building a deeply integrated, proactive client success engine.
Turning Insights into Impactful Actions
Mastering these metrics means embedding them into your daily operations and strategic planning. Your team should not just report on a low Customer Effort Score (CES); they should be empowered to investigate the root cause, identify friction points in the user experience, and implement solutions that make your product easier to use. Similarly, a dip in Monthly Active Users (MAU) isn’t just a number to watch; it’s a critical signal to trigger re-engagement campaigns or personalized outreach.
This transition from a reactive to a proactive model is the hallmark of a world-class customer success organization. It requires a commitment to:
- Contextual Analysis: Don’t just look at a single metric. Correlate your data. For instance, how does a high FCR impact your CSAT and NPS scores over time? Do customers with a higher CLV also have a consistently higher NPS? Answering these questions reveals the interconnectedness of the customer experience.- Trend Monitoring: A single score is a snapshot; a trend is the story. Regularly analyzing these metrics over weeks, months, and quarters helps you identify patterns, predict future behavior, and intervene before a minor issue becomes a reason for churn.- Strategic Alignment: A core component of any robust client success strategy is a well-defined set of customer loyalty strategies. By aligning your metric-driven insights with these broader retention goals, you ensure that every action taken by your CS team contributes directly to long-term business growth and stability.
The Future is Proactive, Not Reactive
Ultimately, the consistent and intelligent application of these client success metrics elevates your business from a mere vendor to an indispensable partner. When you understand your clients’ challenges, anticipate their needs, and demonstrably contribute to their success, you build unbreakable loyalty. This data-driven approach fosters a culture of continuous improvement, where every team member is focused on delivering tangible value. This commitment not only slashes churn and boosts retention but also transforms satisfied customers into your most powerful advocates, creating a self-sustaining cycle of growth.
Ready to automate your data analysis and empower your team with proactive insights? Statisfy integrates all your client success metrics into a single, intelligent platform, providing predictive health scores and actionable recommendations to prevent churn before it happens. Discover how Statisfy can transform your client success strategy today.