Customer Data Insights: Your Guide to Business Growth
By Navin Agrawal · Co-Founder & Head of AI, Statisfy
The Hidden Goldmine in Your Business Data
Imagine you’re a detective, but instead of solving crimes, you’re unlocking the secrets of your customers’ desires. That’s the power of customer data insights. Many businesses, however, treat their data like a forgotten box in the attic, unaware of the treasures it holds. This untapped potential can be a game-changer, shifting your business from simply reacting to market changes to proactively shaping them.
Customer data insights aren’t just about collecting numbers; they’re about deciphering the stories those numbers tell. Think of it like this: a bookstore notices a sudden surge in sales of a specific cookbook. Instead of just celebrating the extra sales, they dig deeper. Looking at online reviews, they discover customers rave about one particular recipe. Armed with this insight, the bookstore features the recipe in their marketing, offers cooking classes focused on it, and even partners with local food suppliers. This deeper understanding boosts sales even further.
This shift from seeing data as cold figures to viewing it as a narrative is where the true magic lies. It’s about spotting the patterns in seemingly random clicks, purchases, and online browsing habits. These patterns illuminate not just what customers are doing, but why. And understanding the “why” is like having a key to anticipating their needs and exceeding their expectations.
Recent studies, like McKinsey’s State of the Consumer report, underscore how crucial this understanding is. They’ve shown how consumer behavior is molded by trends like personalized experiences and new technologies. By carefully analyzing customer data, businesses can tailor what they offer to fit evolving preferences, potentially leading to happier and more loyal customers. Discover more insights. Creating a solid data management plan helps you organize this process, ensuring your business has a roadmap for effectively using this valuable information.
Ultimately, customer data insights empower you to build genuine connections with your customers. By truly grasping their needs, preferences, and pain points, you can craft personalized experiences that encourage loyalty and repeat business. Think of your data as a customized guide for each customer, leading them to the products and services they’ll truly love. This is how businesses gain a real edge, transforming data into a powerful tool that sets them apart in a crowded marketplace.
Reading Between the Lines of Customer Behavior
Your customers are talking to you all the time. Every click, every product view, every purchase (or abandoned cart) tells a story. Customer data insights are about learning to interpret these signals, like a detective piecing together clues. It’s not just what customers do, but why.
Imagine an online clothing retailer sees a lot of abandoned carts for a particular dress. Instead of writing off the lost sales, they investigate. Analyzing customer data, they find that shoppers abandoning the dress are also checking size charts and reading reviews mentioning fit problems. The insight? Possible inconsistent sizing. Now, the retailer can investigate, improve product descriptions, or adjust sizing.
Decoding the Whispers of Customer Data
This ability to interpret customer behavior is what sets successful businesses apart. Companies that master customer data insights can:
Predict Customer Satisfaction: Find patterns that show satisfaction or dissatisfaction, allowing for proactive solutions. Think of a customer repeatedly contacting support for the same issue—a clear sign something’s wrong.
Identify Loyalty Risks: See early warning signs of potential churn, like fewer purchases or negative online reviews. This lets you address problems before a customer leaves.
Spot Upselling Opportunities: Identify natural times to offer related products or services based on past behavior. This feels like helpful suggestions, not pushy sales tactics.

Separating Signal From Noise
Not all data is equally valuable. It’s important to separate meaningful patterns from random noise. This means understanding which behavioral signals really matter for your business. Daily active users might be crucial for a SaaS company, while average order value could be more important for an e-commerce business.
You also need the right tools. AI-powered platforms like Statisfy can automate the process, finding hidden patterns and providing actionable customer data insights that would be impossible to spot manually. This frees up your team to focus on customer relationships and data-driven strategies.
Let’s take a look at how different signals can translate into actionable business insights:
To help illustrate this, consider the following table:
Customer Behavior Signals and Their Business Meanings: A comprehensive breakdown of common customer data patterns and what they reveal about business opportunities. Data SignalWhat It RevealsBusiness ActionExpected ImpactHigh Cart Abandonment RatePotential issues with pricing, shipping costs, or website complexityOffer free shipping, simplify checkout process, A/B test pricingIncreased conversion ratesFrequent Product Page Views Without PurchaseInterest in product but hesitation to buyOffer personalized discounts, showcase customer reviews, improve product descriptionsHigher conversion rates, improved customer engagementIncreased Customer Service InquiriesPotential product defects, difficulty using a feature, or billing issuesProactively address customer concerns, update FAQs, improve product documentationImproved customer satisfaction, reduced churnMultiple Purchases of the Same ProductCustomer loyalty, potential for subscription modelOffer subscription option, provide exclusive discounts for repeat purchasesIncreased customer lifetime value, stronger customer relationshipsPositive Social Media MentionsBrand advocacy, positive customer sentimentEngage with positive comments, share user-generated contentEnhanced brand reputation, increased organic reach This table highlights just a few examples of how seemingly simple data points can tell a rich story about your customer base. By understanding these connections, you can tailor your business strategies for maximum impact.
The Psychology of Customer Behavior
Think of customer actions as outward signs of their inner thoughts and feelings. Browsing history, purchase timing, and even mouse movements can reveal underlying motivations and preferences. Understanding the psychology behind these patterns is key to anticipating needs and creating personalized experiences.
For example, a customer who regularly browses expensive items but never buys might be price-sensitive. Offering a discount or highlighting value-added services could be the encouragement they need to convert. By learning to read between the lines of customer behavior, you can transform raw data into a powerful tool for growth and customer satisfaction. This allows you to not just react to your customers’ actions, but anticipate their needs and build stronger, more profitable relationships.
The Million-Dollar Cost of Data Blindness

Let’s be frank: overlooking customer data insights isn’t just a lost chance—it’s a fast track to financial trouble. Imagine trying to manage a complex supply chain without knowing your inventory levels in real-time. You’re always scrambling to catch up, overstocking items nobody wants, and ultimately, watching your profits disappear.
That’s essentially what happens when businesses ignore their customer data.
The Ripple Effect of Poor Customer Experiences
Negative customer experiences have a knock-on effect. They not only hurt immediate sales but also erode long-term brand loyalty and damage your reputation. Imagine a shopper encountering a clunky, frustrating checkout process. They might abandon their cart today, sure. But that same bad experience can also deter them from future purchases and lead to negative word-of-mouth, shrinking your customer base over time.
This isn’t just a hypothetical scenario; the numbers back it up. Studies show that poor customer service leads to substantial financial losses. U.S. companies, for instance, lose an estimated $75 billion annually due to subpar service. Discover more insights.
Furthermore, reports indicate that only 25% of call centers currently use AI-powered automation. This points to a huge opportunity to improve service and reduce these significant losses. It highlights just how vital customer data insights are for optimizing service quality and the customer journey.
The Hidden Costs of Disconnected Data
Customer service issues are often symptoms of a larger underlying problem: data that isn’t being used effectively. Think about a customer repeatedly calling about their order status. If your systems were connected and offered real-time tracking, that customer could easily monitor their order online, avoiding multiple calls altogether. This improves their experience and reduces your operational costs. It’s a win-win.
Building a Defensive Moat With Data
Businesses that prioritize customer data insights are building a protective wall around their market share that competitors struggle to breach. They anticipate customer needs, proactively address issues, and personalize experiences to encourage loyalty. It’s not just about reacting to problems; it’s about preventing them in the first place.
For instance, by analyzing website traffic and past purchases, you can pinpoint customers who are likely to leave and intervene with targeted offers or individual support. You’re essentially rescuing valuable customers who might otherwise switch to a competitor.
This forward-thinking approach offers a competitive edge, turning customer data from a static record into a powerful engine for growth and lasting success. It’s the difference between constantly putting out fires and preventing them altogether, safeguarding a stable and profitable future.
This data-driven mindset not only tackles current problems but also anticipates future ones, building a resilient business model ready for whatever the market throws its way. The real million-dollar question isn’t whether you can afford to invest in customer data insights – it’s whether you can afford not to.
Understanding the Emotional Side of Customer Data

Beyond the usual demographics and purchase history, there’s a goldmine of information waiting to be explored: your customers’ emotions. Customer data insights, seen through this lens, become less about dry numbers and more about understanding the human beings behind them. It’s like being an emotional detective – every click, every review, every interaction is a clue to what drives customer behavior.
Unearthing Emotional Triggers
Traditional methods like surveys can be misleading. They tell you what people say they think, but not necessarily what they feel. Imagine asking someone why they chose a competitor. They might say “better price,” but the real reason could be a negative experience with your customer service team that left them feeling ignored.
Customer data insights can reveal these hidden emotional triggers. Sentiment analysis of customer service calls can uncover frustration, anger, or even delight. Behavioral patterns, such as repeat purchases or frequent interaction with specific content, can suggest satisfaction and loyalty.
From Frustration to Advocacy: The Emotional Spectrum
Understanding the emotional side of customer data helps you pinpoint moments in the customer journey where emotions have the most impact. Here are a couple of examples:
Frustration Patterns: Analyzing customer service interactions and product usage can reveal recurring pain points. This allows you to proactively solve problems and reduce customer churn. Imagine a software company tracking user behavior. If users consistently struggle with a particular feature, it’s a clear sign that the feature needs improvement or better documentation.
Excitement Signals: Positive social media buzz, enthusiastic reviews, and high engagement with specific product features all signal excitement and the potential for advocacy. Identifying these customers lets you cultivate their enthusiasm, turning satisfied customers into passionate brand champions.
Real-World Applications of Emotional Insights
Smart companies are already using emotional customer data to create more impactful experiences. An online retailer, for example, might analyze browsing and purchase history to spot customers who consistently buy products related to specific life events, like weddings or graduations. This allows for personalized recommendations and marketing messages that resonate on a deeper level. The importance of customer experience (CX) is underscored by the Ipsos CX Global Insights 2025 report, which found that 70% of customers select brands based on the promise of a positive experience. Learn more about these insights. Building strong emotional connections through understanding key drivers like certainty and fair treatment is essential for building loyalty.
Another example might be a streaming service using sentiment analysis of social media chatter to understand audience reactions to new shows. This allows them to adapt marketing strategies or even shape future content based on real-time emotional feedback.
This isn’t about manipulation – it’s about empathy. By understanding the emotional drivers behind customer behavior, you can create experiences that genuinely connect, build stronger relationships, and ultimately, fuel sustainable growth. Tools like Statisfy’s AI-driven agents can help automate this process, giving you valuable insights and freeing up your team to focus on building genuine connections with your customers. This empathetic approach to customer data isn’t just good business – it’s simply human.
See the emotional signals in your own customer data
Start a free trial and Statisfy will surface sentiment, frustration, and advocacy signals from your support and product data automatically, so your team can act on them before a renewal is at risk.
Your Practical Toolkit for Data Analysis
Ready to turn raw customer data into actionable insights? This section is your guide to the tools and techniques that make it happen. Whether you’re a small business owner comfortable with spreadsheets or a large enterprise exploring AI-powered solutions, there’s a method for you. We’ll explore practical steps to build your customer data insights engine, generating meaningful results and avoiding costly mistakes.
Choosing the Right Tools For the Job
Selecting analytical tools can feel overwhelming. Think of it like choosing the right tool for a home repair project. A simple hammer might be perfect for hanging a picture, but you’ll need a power drill for more complex tasks. Similarly, while a complex AI platform might be tempting, a simple spreadsheet like Google Sheets might be all you need to start. The key is finding the right fit for your business size, budget, and data maturity.
For smaller businesses, even simple spreadsheet software can be surprisingly powerful. You can track key metrics, segment customers, and even visualize trends. For example, identifying your most loyal customers is as simple as analyzing their purchase frequency and average order value.
As your business grows and your data becomes more complex, dedicated analytics platforms become essential. Tools like Mixpanel or Amplitude offer advanced features like cohort analysis, customer journey mapping, and predictive modeling.
Let’s look at how different businesses might approach data analysis:
Customer Data Analysis Methods by Business Size and Complexity Business SizeAvailable ToolsRecommended MethodsExpected ROI TimelineSmall StartupSpreadsheets (e.g., Excel, Google Sheets)Basic segmentation, trend analysisShort-term (weeks to months)Growing SMESpreadsheet software + Basic analytics platforms (e.g., Google Analytics)Cohort analysis, customer journey mappingMid-term (months to a year)Large EnterpriseAdvanced analytics platforms (e.g., Mixpanel, Amplitude) + AI-powered solutionsPredictive modeling, real-time personalizationLong-term (a year or more) This table illustrates how the complexity of analysis methods and the expected return on investment timeline typically increase with business size and data sophistication. Smaller businesses can achieve quick wins with basic tools, while larger enterprises benefit from more complex, long-term strategies.
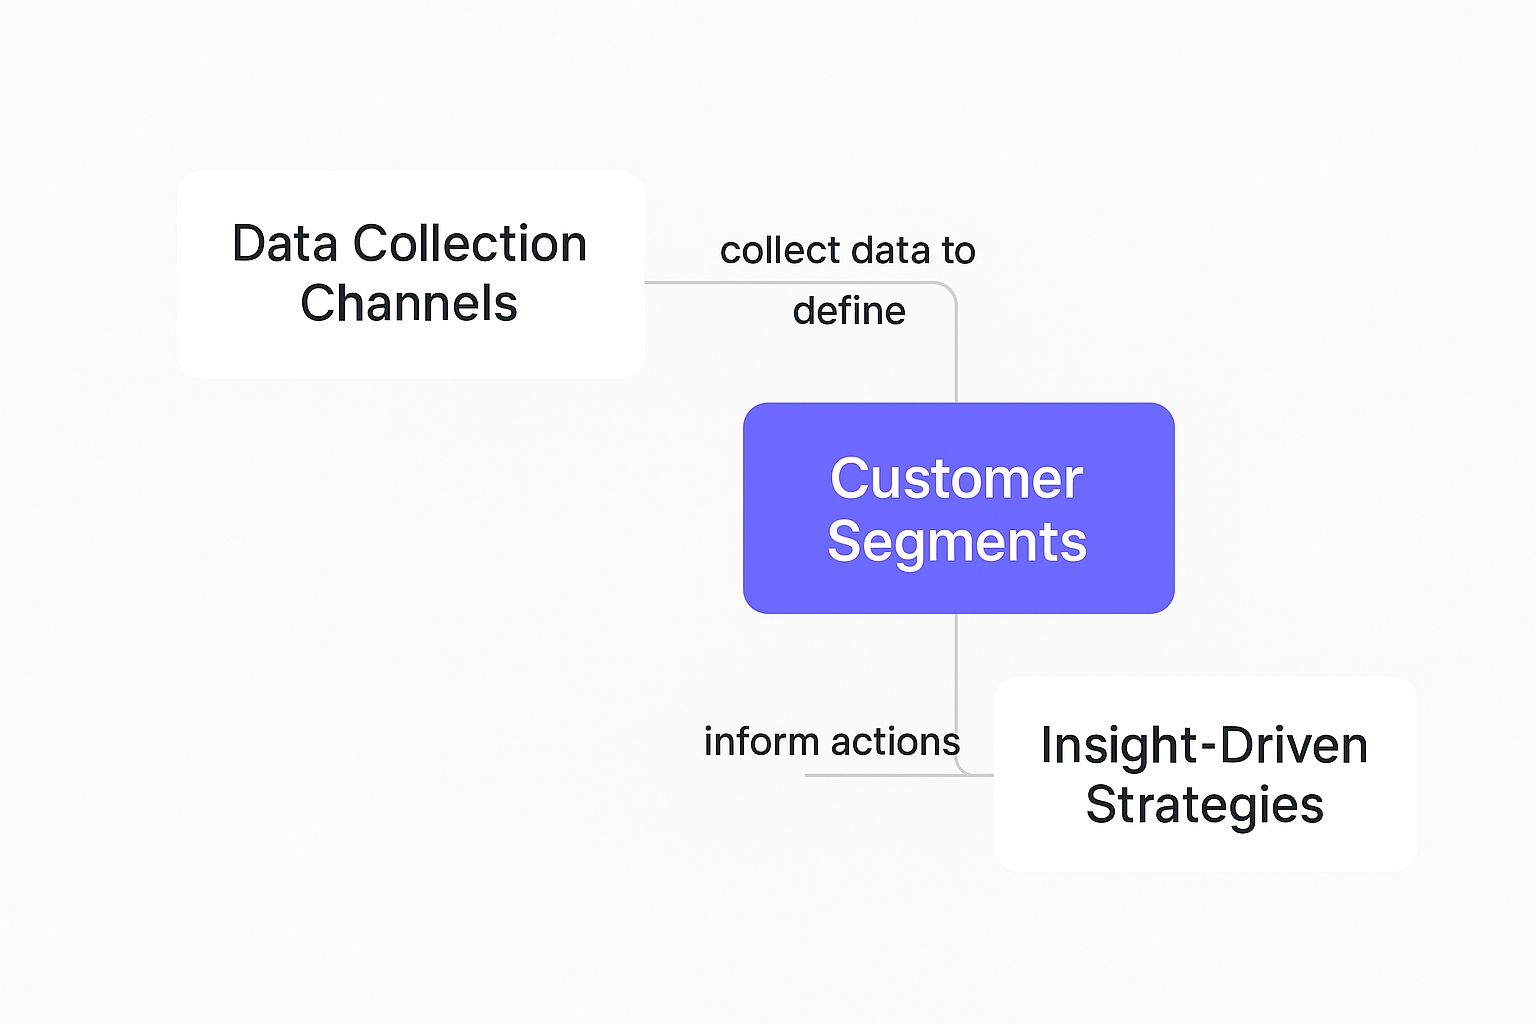
This infographic visualizes the journey from data collection to insight-driven strategies. Think of it as a roadmap: various channels (like website analytics and customer surveys) feed information about different customer segments, allowing you to create targeted and effective strategies.
Implementing Effective Data Collection Systems
Having the right tools is only half the battle. You also need effective data collection systems. Imagine trying to bake a cake without the right ingredients. You might have the best oven in the world, but you still won’t get a cake.
Here are some steps to get you started:
Define Your Objectives: Start by asking what you want to learn. Do you want to understand why customers abandon their carts or discover which marketing channels are most effective?
Identify Key Metrics: Focus on the data points that directly answer your questions. If you’re concerned about cart abandonment, track metrics like cart abandonment rate, checkout completion rate, and average order value.
Choose Your Data Sources: Your data could come from various places: your website analytics (like Google Analytics), your CRM system (like Salesforce), or even customer surveys.
Integrate Your Systems: Ensure your data sources can “talk” to each other. This gives you a holistic view of the customer journey and allows for deeper insights.
Mastering Key Analysis Techniques
Turning raw data into customer data insights requires mastering a few key analytical techniques. Think of these as your detective tools for uncovering hidden clues about your customers.
Customer Journey Mapping: This involves visualizing the steps your customers take when interacting with your business. Imagine walking in your customers’ shoes. This helps you identify pain points and areas for improvement.
Cohort Analysis: This involves grouping customers based on shared characteristics (like their acquisition date) and tracking their behavior over time. Imagine observing different groups of customers as they interact with your product. This helps you understand the customer lifecycle and identify churn risks.
Predictive Modeling: This involves using historical data to predict future behavior. Imagine having a crystal ball that tells you what your customers will do next. This allows you to anticipate their needs and personalize their experiences.
Platforms like Statisfy utilize AI to make this process smoother. The goal is to make complex analysis accessible and actionable, so you can make better decisions.
Avoiding Common Pitfalls
Even with the best tools and techniques, there are common mistakes to avoid. One of the biggest is analysis paralysis—getting bogged down in data without taking action. It’s like having a fully stocked toolbox but never actually building anything.
Prioritize your insights. Focus on those that have the biggest potential impact. Also, don’t forget to communicate your findings. Data insights are only valuable if they’re used to inform decisions. Secure support from key stakeholders by clearly explaining the benefits of a data-driven approach. Finally, measure your success. Tracking the impact of your data-driven initiatives allows you to refine your approach and demonstrate the value of your customer data insights investments.
Turning Insights Into Measurable Business Results
Having customer data insights is like having a treasure map. It’s exciting, full of potential, but ultimately worthless if you don’t actually use it to find the buried treasure. This section is about digging for that treasure – translating those data insights into real-world business improvements that impact your bottom line.
From Data to Dollars: Strategies for Implementation
Implementing changes based on customer data insights doesn’t have to mean a massive, company-wide overhaul. It can start small, with quick wins that prove the value of a data-driven approach. Think of it like trying a new exercise routine. You wouldn’t immediately run a marathon. You’d start with shorter runs, gradually building strength and stamina.
You might, for example, A/B test a new call to action button on your website based on customer click-through rates. If the data shows an increase in conversions, that’s a quick win, a small victory that builds momentum and encourages bigger, more ambitious data-driven projects.
This iterative process, this constant testing and refining based on data feedback, is essential. For deeper insights on refining your tracking, check out this article on customer data tracking. It’s about continuous improvement, always looking for new ways to optimize the customer experience and, as a result, drive business results.
For long-term strategies, consider initiatives that reshape the entire customer journey. Imagine an e-commerce business analyzing data and realizing customers often abandon their carts during the shipping stage. This insight might lead to offering free shipping or more transparent shipping costs, directly addressing the issue and potentially increasing sales.
Prioritizing for Maximum Impact
Not all insights are equal. Some offer small, incremental improvements, while others have the power to significantly impact your business. Think of a gardener tending to their plants. They would naturally focus their attention on the plants that need it most.
Similarly, prioritize the customer data insights that address your biggest business challenges or offer the highest potential return. For example, if acquiring new customers is a major hurdle, focus on insights related to marketing and lead generation.
Building Internal Buy-In
Data-driven decisions are more effective with buy-in from everyone involved. It’s like rowing a boat – everyone needs to be pulling in the same direction. Present your findings clearly, using visuals and avoiding jargon. Show how these data-driven changes will benefit everyone, whether it’s increased revenue, reduced costs, or a better work environment.
Measuring Success: What Matters Most
Data insights are only valuable if they produce tangible results. Define clear metrics that align with your business goals and track the impact of your initiatives. This might include increases in customer satisfaction, sales conversions, or website traffic. Think of a scientist conducting an experiment. They carefully measure and document their findings to understand the impact of their work.
Don’t just focus on the big picture; break it down into smaller, measurable components. This granular approach lets you see what’s working, what’s not, and adjust your strategies accordingly.
Case Studies: Data in Action
Real-world examples demonstrate the power of customer data insights. One company noticed a drop in customer engagement after launching a new website feature. Through user feedback and website analytics, they realized the feature was confusing and difficult to use. By simplifying the feature based on the data, they saw a 15% increase in customer engagement.
Another company, through analyzing customer purchase history, realized a particular product was consistently purchased alongside another. By offering bundled discounts for these items, they increased sales of both products by 10%. This shows the value of not just collecting data, but truly understanding what it’s telling you about your customers. It’s about moving beyond assumptions and making decisions based on real customer behavior.
Building Your Long-Term Data Strategy
The world of customer data insights is constantly changing. Think of it like navigating by the stars – you need to understand the constellations (your current tools) but also be prepared for unexpected meteor showers (new opportunities). A solid long-term strategy helps you chart a course and stay on track.
Future-Proofing Your Business Intelligence
Building a future-proof data strategy means understanding data-driven marketing strategies and preparing for what’s next. AI-powered predictive modeling, for example, can spot opportunities months in advance, like a seasoned farmer predicting a bountiful harvest based on early weather patterns. This allows you to anticipate shifts in customer demand and adjust your inventory accordingly.
On the other hand, real-time behavioral analysis offers immediate personalization. Imagine a friendly shopkeeper who knows your preferences so well, they can suggest exactly what you need the moment you walk in the door. That’s the power of real-time analysis on your website – tailoring the experience to each individual customer.
Building Adaptable Data Systems
Your data systems should be like a growing tree, becoming stronger and more insightful with time. Imagine planting a sapling that eventually becomes a mighty oak, providing shade and shelter for years to come. This requires building systems that can adapt to your evolving needs.
Here’s what to consider:
- Scalability: Your system needs to handle more data as your business grows, like expanding a bookshelf to accommodate your growing library.- Interoperability: Different data sources should connect seamlessly, like pieces of a puzzle fitting together to form a complete picture of your customer.- Flexibility: Your system should embrace new technologies and analytical methods, just as a seasoned traveler adapts to different cultures and customs.
Investing in Your Team’s Capabilities
Technology may change, but a skilled team is always valuable. It’s like investing in a set of high-quality tools – they’ll remain useful even as technology advances. Focus on developing these key skills:
- Data Interpretation: The ability to uncover the story hidden within the data, like an archaeologist piecing together ancient artifacts.- Critical Thinking: The ability to question assumptions and identify potential biases, like a detective examining evidence for inconsistencies.- Communication: The ability to clearly explain complex insights, like a teacher explaining a difficult concept to students.
Balancing Innovation and Practical Implementation
A successful long-term data strategy blends innovation with practical application. Think of it like learning to cook – you start with simple recipes before attempting complex dishes. Begin with small, achievable projects that showcase the value of data insights. As your team gains experience, gradually introduce more advanced techniques. This iterative approach, like building a house brick by brick, minimizes risk and sets you up for long-term success, ensuring that your customer data insights strategy provides ongoing value today and prepares you for the opportunities of tomorrow.
Ready to unlock the full potential of your customer data? Statisfy’s AI-driven platform empowers your team to transform raw data into actionable insights, driving growth and improving customer relationships.
Turn your customer data into insights this week
Start a free trial and connect your existing tools — Statisfy will start surfacing actionable customer insights automatically, no data science team required.