
8 Essential Customer Health Score Metrics for 2025
By Navin Agrawal · Co-Founder & Head of AI, Statisfy
In today’s competitive landscape, understanding customer sentiment isn’t just a bonus; it’s the backbone of sustainable growth. But how do you move from a vague ‘feeling’ about customer satisfaction to a data-driven strategy? The answer lies in establishing a robust customer health score. This score is a predictive metric that quantifies the likelihood of a customer to grow, renew, or churn. By combining various data points, you can create a comprehensive picture of account well-being, enabling your customer success teams to act proactively instead of reactively.
This guide will explore the 8 most critical customer health score metrics that provide actionable insights. We will break down what they are, how to calculate them, industry benchmarks, and practical tips for integrating them into your customer success framework. For a comprehensive guide to building a robust customer health scoring system and leveraging it for predictive success, explore a detailed overview of Customer Health Score Mastery.
Moving beyond simple satisfaction surveys, these metrics offer a holistic view of the customer relationship. From product engagement and support interactions to direct feedback, each component tells a part of the story. By mastering these indicators, you can transform your approach from reactive problem-solving to proactive partnership, ultimately building stronger, more profitable customer relationships.
1. Net Promoter Score (NPS)
Net Promoter Score (NPS) is a foundational metric for gauging customer loyalty and predicting future business growth. It’s one of the most widely adopted customer health score metrics because it hinges on a single, powerful question: “On a scale of 0-10, how likely are you to recommend our company/product/service to a friend or colleague?” This direct approach simplifies feedback into an easily trackable score.
Based on their responses, customers are segmented into three distinct categories:
- Promoters (9-10): Your most loyal and enthusiastic advocates. They are repeat buyers who actively refer others, fueling your growth.- Passives (7-8): Satisfied but unenthusiastic customers. They are vulnerable to competitive offers and aren’t actively promoting your brand.- Detractors (0-6): Unhappy customers who can damage your brand through negative word-of-mouth and churn.
To truly leverage NPS, it’s essential to understand not just what it is, but precisely how to calculate your NPS score. The final score is calculated by subtracting the percentage of Detractors from the percentage of Promoters, resulting in a number that ranges from -100 to +100.
How to Implement and Leverage NPS
Simply collecting the score isn’t enough. The real value comes from the actions you take based on the feedback.
- Follow Up with Context: Always ask an open-ended follow-up question, such as “What is the primary reason for your score?” This qualitative data provides crucial context and actionable insights.- Segment Your Data: Analyze NPS across different customer segments, such as by product line, subscription tier, or user persona. This helps pinpoint specific areas of strength and weakness. For example, you might find that enterprise clients are Promoters while SMB clients are Passives, indicating a need to improve your offering for smaller businesses.- Close the Loop: Make it a priority to respond to feedback, especially from Detractors. Acknowledge their issues and outline the steps you’re taking to address them. This can often turn an unhappy customer into a loyal advocate.
The following bar chart illustrates how these three customer segments contribute to the overall score calculation.
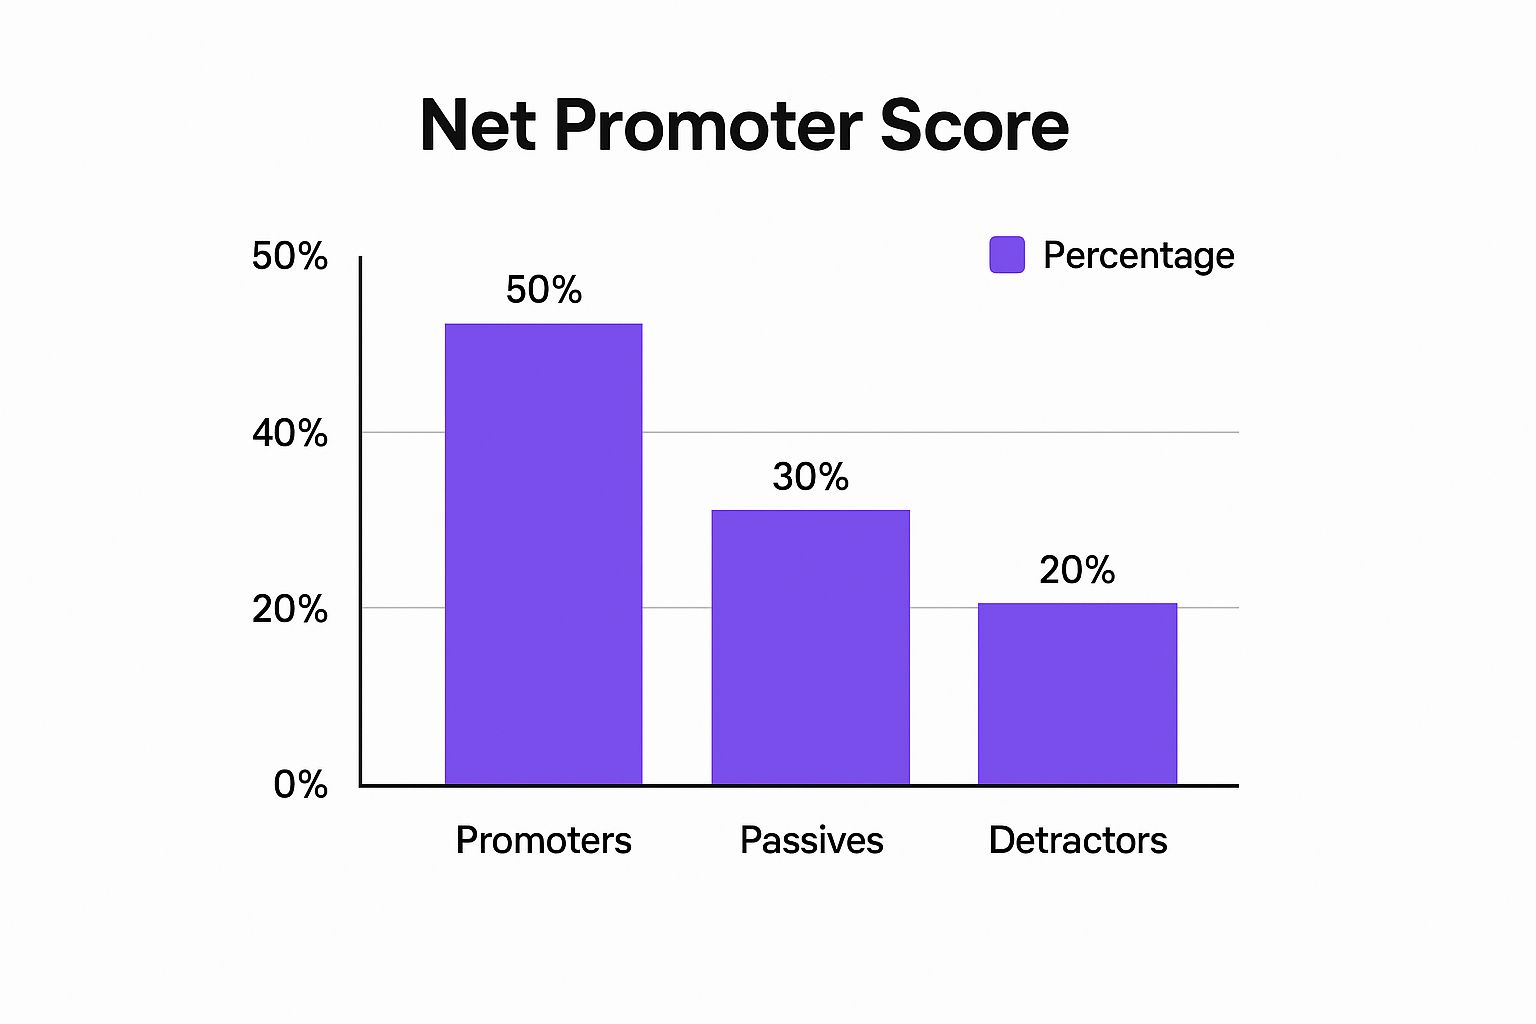
As visualized, even with a high number of Promoters, a significant group of Detractors can substantially lower the final NPS, highlighting the importance of addressing customer dissatisfaction.
2. Customer Satisfaction Score (CSAT)
Customer Satisfaction Score (CSAT) is a transactional metric that measures a customer’s satisfaction with a specific interaction, product feature, or service experience. Unlike broader loyalty metrics, CSAT provides immediate, granular feedback on key moments in the customer journey. It typically asks a direct question like, “How would you rate your overall satisfaction with the [service/product] you received?”
Responses are collected on a simple scale, often 1-5 or 1-10. This makes it one of the most straightforward customer health score metrics to implement and track. Customers are generally grouped as follows on a 5-point scale:
- Satisfied (4-5): Customers who had a positive experience. These are the responses you want to maximize.- Neutral (3): Customers who were neither satisfied nor dissatisfied. Their experience was adequate but not memorable.- Dissatisfied (1-2): Unhappy customers who experienced friction or failed to achieve their desired outcome.
The final CSAT score is typically calculated as the percentage of satisfied customers. You find it by dividing the number of satisfied responses (e.g., those who rated 4 or 5) by the total number of responses and then multiplying by 100. For example, if you received 100 responses and 75 were a 4 or 5, your CSAT score would be 75%.
How to Implement and Leverage CSAT
Gathering a CSAT score is only the first step. The real power comes from using this feedback to drive immediate improvements.
- Deploy Surveys at the Right Time: Trigger CSAT surveys immediately after a key interaction has concluded. For instance, Uber requests a ride rating right after the trip ends, and support platforms like Zendesk often send a survey after a support ticket is resolved. This ensures the experience is fresh in the customer’s mind.- Keep it Short and Focused: A CSAT survey should be quick and to the point. A single question about satisfaction is often enough. Adding an optional open-ended field like “Tell us a bit more about why you chose that score” can provide invaluable qualitative context without creating friction.- Automate Low Score Alerts: Set up automated workflows to alert the appropriate team members, such as a Customer Success Manager, whenever a low score is submitted. This enables rapid intervention to address the customer’s issue, potentially turning a negative experience into a positive one and preventing churn. For example, a low score after a product onboarding session could trigger an immediate follow-up call.
3. Customer Effort Score (CES)
Customer Effort Score (CES) is a crucial transactional metric that measures how easy it is for a customer to interact with your company. Popularized by research in the Harvard Business Review and detailed in the book The Effortless Experience, it operates on the principle that reducing customer effort is a more reliable driver of loyalty than delighting customers. CES typically asks, “To what extent do you agree or disagree with the following statement: The company made it easy for me to handle my issue?” on a scale of 1 (Strongly Disagree) to 7 (Strongly Agree).

Unlike other customer health score metrics that gauge overall sentiment, CES provides a laser-focused view of specific touchpoints. A low-effort experience, such as a quick issue resolution or a seamless checkout process, is a strong predictor of repeat business and increased spending. Conversely, a high-effort interaction is a significant driver of customer churn. Companies like Amazon use CES to optimize their checkout process, while Spotify measures the effort required for users to discover new music.
How to Implement and Leverage CES
The power of CES lies in its ability to pinpoint and eliminate friction in the customer journey. It’s not just about a score; it’s a diagnostic tool for process improvement.
- Deploy at Key Touchpoints: Trigger CES surveys immediately following specific interactions, not randomly. The best times are after a support ticket is closed, a purchase is completed, or a user engages with a complex feature for the first time.- Analyze High-Effort Triggers: Don’t just track the average score. Dig into the responses that indicate high effort. Combine this feedback with process analytics data to understand why an interaction was difficult and identify the root cause, whether it’s a confusing UI, a flawed policy, or a training gap.- Empower Teams to Reduce Effort: Train your support and success teams to actively listen for signs of customer struggle. Empower them to solve problems without unnecessary escalations or transfers, directly reducing the effort required from the customer. Monitor CES trends over time to validate the impact of your improvements.
4. Product Usage Frequency
Product Usage Frequency is a critical behavioral metric that measures how often customers actively engage with your product or service. This metric moves beyond sentiment to track concrete actions, providing a direct view into whether customers are integrating your solution into their regular workflows. It’s a powerful leading indicator of customer health, stickiness, and the likelihood of renewal.
Usage frequency is typically measured over specific timeframes, creating segments like:
- Daily Active Users (DAUs): Customers who use the product every day. This is crucial for products like communication tools (e.g., Slack) or CRMs (e.g., Salesforce).- Weekly Active Users (WAUs): Users who engage on a weekly basis. This might apply to project management or analytics platforms.- Monthly Active Users (MAUs): Customers who find value in the product at least once a month, common for reporting or financial tools.
Understanding these patterns is a core component of building effective customer health score metrics. For instance, a video conferencing platform like Zoom would analyze not just how many meetings are held, but their frequency and duration. A sudden drop in a customer’s meeting frequency could be an early warning sign of churn risk, prompting a proactive check-in from a customer success manager.
How to Implement and Leverage Product Usage Frequency
Merely tracking logins is insufficient; the real insight comes from defining and monitoring meaningful user actions.
- Define Meaningful Actions: Identify the core, value-driving actions within your product. For Adobe Creative Cloud, this isn’t just opening the app but time spent using specific tools. For an e-commerce platform, it could be listing new products or processing orders.- Track Both Frequency and Depth: Don’t just count how often users log in. Measure how many key features they use during each session. A customer using one feature daily is less healthy than a customer using five features three times a week.- Segment Users by Usage Patterns: Group customers into tiers like “power users,” “casual users,” and “at-risk users” based on their activity levels. This allows you to tailor your communication, offering advanced tips to power users and re-engagement campaigns to those at risk.- Set Up Automated Alerts: Implement triggers that notify your customer success team when a previously active account shows a significant drop in usage. This enables immediate and targeted outreach to understand and resolve any issues before they escalate.
5. Support Ticket Volume and Resolution Time
Support Ticket Volume and Resolution Time offer a direct, operational view into the customer experience. This metric analyzes how often a customer needs help and how efficiently their problems are solved. A sudden spike in tickets from an otherwise quiet account can signal significant user frustration or a critical product failure, making it a powerful, real-time indicator among customer health score metrics.
This metric combines two key data points:
- Ticket Volume: The total number of support requests a customer submits over a specific period. Consistently high volume might indicate a poor product fit or a need for better user training. For instance, Zendesk often tracks ticket trends for enterprise clients to proactively identify potential issues.- Resolution Time: The average time it takes for your support team to resolve a customer’s tickets. Long resolution times directly correlate with decreased customer satisfaction and can be a leading indicator of churn.
By monitoring both aspects, you gain a holistic understanding of a customer’s hands-on experience with your product and support systems. A healthy customer is one who either requires minimal support or has their issues resolved quickly and effectively. For a deeper understanding of the operational metrics that contribute to customer health, you can explore these 8 Essential Service Desk Metrics that influence this score.
How to Implement and Leverage Support Metrics
Effectively using support data requires moving beyond simple counting and looking for actionable patterns.
- Establish Clear SLAs: Set and monitor Service Level Agreement (SLA) targets based on ticket priority and type. A high-priority bug should have a much faster target resolution time than a simple “how-to” question.- Analyze Ticket Categories: Go beyond volume and resolution time by categorizing tickets. HubSpot, for example, analyzes ticket themes to inform its product development roadmap, turning support data into feature improvements.- Monitor Escalation Rates: Track how often a customer’s tickets are escalated to senior support or engineering. A high escalation rate for a specific account suggests they are facing complex problems your frontline support cannot handle, indicating a serious health risk.- Implement Proactive Outreach: Don’t wait for a high-volume customer to complain. Use the data to trigger proactive outreach from a Customer Success Manager to offer additional training, resources, or a strategic review of their account. This transforms a negative signal into a positive, relationship-building interaction.
6. Feature Adoption Rate
Feature Adoption Rate measures how many of your customers are actively using a specific product feature. It goes beyond simple login counts to reveal the depth of user engagement and whether your product development efforts are delivering real value. Tracking this metric is vital for understanding which features contribute to product stickiness and which ones might be overlooked or poorly designed.
A low feature adoption rate can signal several issues:
- Poor Discovery: Customers may not know the feature exists.- Low Perceived Value: Users don’t understand how the feature benefits them.- Usability Problems: The feature is too complex or difficult to use.
Conversely, high adoption of key features is a strong indicator of a healthy customer. For example, a business using project management software might track the adoption of its “automated reporting” feature. If adoption is high, it suggests customers find significant value in the time-saving capabilities, making them less likely to churn.
How to Implement and Leverage Feature Adoption Rate
Effectively tracking feature adoption requires a clear strategy and the right tools to turn data into action.
- Define Clear Activation Events: Determine what “using” a feature actually means. Is it one click? Is it completing a full workflow? For a feature like Zoom’s breakout rooms, an activation event might be defined as a user who successfully creates and launches at least one breakout session.- Track Adoption by Cohort: Analyze adoption rates across different customer segments or sign-up cohorts. You might discover that new users adopt a feature more quickly than legacy users, indicating that your onboarding process is effective but you need to educate your existing customer base.- Implement In-App Guidance: For features with low adoption, use in-app tooltips, guides, or pop-up tutorials to walk users through the benefits and functionality. This proactive education can significantly boost engagement without requiring manual intervention from your team.- Correlate with Retention: The most powerful use of this metric is to connect feature adoption with customer retention. By identifying which features are most used by your longest-retained customers, you can focus your onboarding and success efforts on guiding all users toward these “sticky” functionalities.
7. Renewal/Churn Risk Score
A Renewal/Churn Risk Score is a powerful, predictive metric that forecasts the likelihood of a customer churning or renewing their subscription. Unlike single-input metrics, this score synthesizes multiple data points, often leveraging machine learning to analyze complex patterns in customer behavior, engagement, and support history. This forward-looking approach allows teams to proactively identify at-risk accounts before they show obvious signs of disengagement.
This score is typically a dynamic number or a categorical label (e.g., High, Medium, Low Risk) generated by analyzing signals such as:
- Behavioral Data: Declining product usage, feature abandonment, or infrequent logins.- Engagement Metrics: Low email open rates, lack of participation in webinars, or decreased marketing engagement.- Support Interactions: A recent spike in support tickets, unresolved issues, or negative feedback on support quality.- Contractual & Firmographic Data: Upcoming renewal date, original contract value, or changes in company size.
Customer success platforms like ChurnZero and Gainsight have popularized this approach, using predictive analytics to give CSMs an early warning system for potential churn. This allows for timely, targeted interventions.
How to Implement and Leverage a Renewal/Churn Risk Score
The effectiveness of this score depends on the quality of your data and the clarity of your response plan.
- Combine Behavioral and Engagement Data: A holistic view is critical. A customer might have high product usage but has stopped engaging with your community or marketing content, a subtle but important red flag that a simple usage metric would miss.- Create Clear Intervention Playbooks: Don’t just identify risk; define action. For a high-risk account, the playbook might trigger an immediate executive check-in, a technical health audit, and a custom re-engagement campaign. For a medium-risk account, it might prompt a standard CSM check-in.- Regularly Validate and Update Models: Your business and customers evolve, and so should your prediction model. Regularly test its accuracy against actual renewal outcomes and refine the data inputs and weighting to improve its predictive power. This is a key step in ensuring your churn risk score remains one of your most reliable customer health score metrics.
8. Customer Lifetime Value to Customer Acquisition Cost Ratio (CLV:CAC)
The Customer Lifetime Value to Customer Acquisition Cost (CLV:CAC) ratio is a crucial financial metric that directly assesses the profitability and sustainability of your customer base. It moves beyond simple satisfaction scores to answer a fundamental business question: “For every dollar we spend to acquire a new customer, how much revenue will that customer generate over their entire relationship with us?” This ratio is one of the most powerful customer health score metrics for evaluating long-term business viability.

The CLV:CAC ratio provides a clear verdict on the effectiveness of your sales and marketing efforts. A healthy ratio indicates you are acquiring customers who are not only valuable but are also acquired efficiently. For instance, SaaS companies often aim for a ratio of at least 3:1, meaning a customer’s lifetime value is three times the cost of acquiring them. A ratio below 1:1 suggests you are losing money on each new customer, signaling an unsustainable growth model.
How to Implement and Leverage the CLV:CAC Ratio
Calculating this ratio is the first step; the real strategic advantage comes from using it to guide decisions across the business.
- Segment by Acquisition Channel: Don’t just calculate a single, company-wide ratio. Analyze CLV:CAC for different acquisition channels like organic search, paid ads, and referrals. This will reveal which channels bring in the most profitable customers, allowing you to reallocate your marketing budget effectively.- Ensure Comprehensive CAC Calculation: To get an accurate ratio, your Customer Acquisition Cost must include all expenses involved in winning a new customer. This includes marketing and sales salaries, ad spend, software costs, and any related overhead. Incomplete cost data will result in a misleadingly high ratio.- Optimize for Payback Period: While a high CLV:CAC ratio is good, also consider the payback period, the time it takes to recoup the initial CAC. A healthy business model balances a strong ratio with a reasonably short payback period (typically under 12 months for SaaS) to maintain healthy cash flow.- Factor in Expansion Revenue: For a complete picture, ensure your CLV calculation includes potential expansion revenue from upsells, cross-sells, and add-ons. The healthiest customers not only stay but also increase their spending over time, significantly boosting their lifetime value and improving the overall ratio.
Customer Health Score Metrics Comparison
MetricImplementation Complexity 🔄Resource Requirements 🔄Expected Outcomes 📊Ideal Use Cases 💡Key Advantages ⭐⚡Net Promoter Score (NPS)Low - simple survey setupLow - single question, automatedMeasures customer loyalty & growth potentialTracking long-term loyalty & benchmarkingWidely recognized, easy to communicate ⭐, low survey fatigue ⚡Customer Satisfaction Score (CSAT)Low - simple transactions surveysLow - quick post-interaction surveysImmediate actionable feedback on experiencesMeasuring satisfaction after specific interactionsHigh response rates ⚡, transaction-specific insights 💡Customer Effort Score (CES)Moderate - requires careful question designModerate - targeted post-resolutionPredicts loyalty based on effort requiredIdentifying friction points & improving processesStrong predictor of loyalty ⭐, actionable for process improvementsProduct Usage FrequencyHigh - requires analytics setupHigh - ongoing data capture & analysisReal-time behavioral insights on engagementMonitoring engagement and health for digital productsObjective behavior data ⭐, real-time insights ⚡Support Ticket Volume & ResolutionModerate - needs integration with supportModerate - ticket tracking systemsIdentifies support efficiency & customer pain pointsCustomer support performance & issue resolution trackingMeasures support performance, early dissatisfaction warning 📊Feature Adoption RateHigh - requires detailed product analyticsHigh - data tracking & segmentationMeasures feature engagement and product ROIAssessing feature success & guiding product developmentGuides product prioritization, reveals user behavior ⭐Renewal/Churn Risk ScoreHigh - predictive modeling & data integrationHigh - analytics infrastructurePredicts churn/renewal likelihood earlyPrioritizing retention & proactive interventionsEnables early warning, improves retention ⭐CLV:CAC RatioHigh - financial modeling & data gatheringModerate - requires marketing & finance dataAssesses profitability of acquisition effortsGrowth strategy and customer segment value analysisDirect link to profitability, informs investment decisions ⭐
From metrics to momentum: Activating your customer health strategy
Navigating the landscape of customer health score metrics can feel like assembling a complex puzzle. We’ve explored a wide array of powerful indicators, from direct feedback mechanisms like NPS and CSAT to behavioral insights derived from product usage frequency and feature adoption. Each metric, whether it’s the operational efficiency reflected in support ticket resolution times or the financial viability measured by the CLV:CAC ratio, offers a distinct and valuable perspective. However, their true power isn’t in isolation; it’s in their synthesis.
The ultimate goal is to move beyond a static, one-dimensional view of your customers. A high NPS score is fantastic, but it tells an incomplete story if that same customer has drastically reduced their product usage. Similarly, a high feature adoption rate is promising, but less so if the account is flooding your support team with tickets. True customer health intelligence emerges when these disparate data points are woven together into a single, cohesive narrative.
The Shift from Measurement to Proactive Management
Mastering customer health isn’t about simply collecting data; it’s about activating it. The transition from passively measuring to proactively managing customer relationships is the cornerstone of a modern customer success strategy. This requires a system that doesn’t just track metrics but interprets them, identifying patterns and flagging deviations before they escalate into critical issues.
This is where the real work begins, and it’s where many organizations stumble. The challenge lies in creating a scalable, repeatable process that turns raw numbers into strategic interventions. To do this effectively, you must:
- Integrate Data Sources: Your CRM, support desk, product analytics tools, and survey platforms must communicate. A unified view is non-negotiable for creating a holistic health score.- Automate Analysis: Manually calculating and cross-referencing these metrics for every single customer is impossible at scale. Automation is essential for real-time insights and freeing your team for high-value activities.- Establish Clear Triggers: Define what a “good” or “bad” score looks like. Set up automated alerts and playbooks that trigger specific actions when a customer’s health score changes, ensuring a consistent and timely response.
Key Takeaway: The most successful customer-centric organizations don’t just track customer health score metrics; they build an operational framework around them. This framework automates data collection, synthesizes insights, and empowers their teams to act decisively.
By connecting these metrics, you build a predictive engine for your business. You can foresee churn risk, identify expansion opportunities, and deliver personalized engagement that fosters loyalty and turns customers into advocates. This proactive stance transforms your Customer Success team from a reactive, fire-fighting unit into a strategic growth driver, fundamentally impacting your bottom line and securing long-term, sustainable success.
Ready to transform your scattered data points into a powerful, predictive customer health strategy? See how Statisfy automates the entire process, from data integration to AI-powered insights and actionable playbooks. Discover Statisfy and empower your team to drive retention and growth at scale.