
Customer Health Scores: Your Complete Guide to Predictions
By Navin Agrawal · Co-Founder & Head of AI, Statisfy
What Customer Health Scores Really Mean For Your Business
Think of customer health scores as your business’s canary in the coal mine. They’re like a silent conversation, giving you insights into each customer’s experience without a single phone call. Many companies see these scores as just another number, but they’re actually much more powerful. Successful teams use them to predict customer behavior months in advance, transforming raw data into meaningful actions.
This proactive approach is essential in today’s competitive landscape. By understanding what influences customer health, you can anticipate potential churn and take steps to prevent it. This might involve offering tailored support, showcasing useful features, or simply checking in to ensure everything is running smoothly. These proactive measures can dramatically improve customer retention and overall satisfaction.
Customer health scores have become a vital tool for businesses looking to strengthen their customer relationships. Interestingly, companies with over 100 customers are more likely to use them, showing a 7% higher adoption rate than smaller companies. To help you get started, a general implementation roadmap can be a valuable resource. You can also delve deeper into the growing importance of customer health scores here.
Why Traditional Approaches Often Fall Short
Traditional methods often rely on lagging indicators like churn rate, which only tell you who’s already left. It’s like looking in the rearview mirror - it tells you where you’ve been, not where you’re going. Customer health scores, on the other hand, are leading indicators, offering a glimpse into the future.
They help you spot at-risk customers before they churn, giving you time to intervene and improve their experience. This proactive approach is far more effective than simply reacting to churn after the fact. Imagine a doctor treating symptoms after a disease has taken hold versus catching it early and preventing it altogether.
By shifting from reactive to proactive, businesses can cultivate stronger customer relationships and boost long-term retention. It’s about building a partnership, not just making a sale.
The Metrics That Actually Matter for Health Scoring

Think of choosing the right metrics for your customer health scores like choosing ingredients for a cake. The wrong combination can lead to a disaster, but the right mix creates something truly delightful. It’s not about blindly collecting data, it’s about picking out the predictive indicators that tell a story about your customers’ future.
What will they do next? Will they stay, will they go, will they buy more? Your metrics should offer clues.
Beyond Vanity Metrics: Focusing on What Truly Predicts Success
Too often, companies get caught up tracking vanity metrics – numbers that look good on paper but don’t tell the whole story. Website visits or free trial sign-ups might seem positive, but they don’t guarantee long-term customers. Think of it like a crowded store – lots of people browsing, but how many actually buy something?
Instead, focus on metrics that show customer intent. What are they really planning to do? This means looking at product usage patterns. Are customers regularly using key features? Are they exploring new functionalities? This kind of engagement is much more telling than simply seeing how often they log in.
It’s like the difference between someone who walks into a gym and someone who actually uses the equipment. One is just looking, the other is committed.
Additionally, consider the depth of usage. A customer using many different features is likely more invested than someone using just one. They’re exploring the full menu, not just ordering the same dish every time.
Deciphering the Signals: Support Tickets and Engagement Depth
A high number of support tickets might seem bad, but it’s not always a negative. Sometimes, frequent support interaction indicates a highly engaged customer who’s actively using your product and needs help getting the most out of it. Think of them as eager students asking lots of questions.
Look at the context of the support tickets. Are they about bugs, or are they requests for more advanced features? One signals frustration, the other signals a desire to go deeper.
Engagement depth often trumps engagement frequency. A customer who spends hours in your product, even if they visit less often, might be more valuable than someone who logs in daily but only for a few minutes. It’s the quality of the interaction, not the quantity, that truly matters.
Tailoring Your Metrics: Aligning with Customer Journey Stages
Just like a plant needs different care at different growth stages, your customers need different metrics at different stages of their journey. A new customer’s health is measured differently than a long-term subscriber’s.
For new customers during onboarding, completing key setup steps and initial product exploration are important. It’s like making sure a seedling gets enough water and sunlight.
Later, metrics like feature adoption, usage frequency, and expansion activity become more relevant. Now you’re watching the plant grow taller and stronger.
By tailoring your customer health scores to these different stages, you get a clearer picture of your customers’ progress. This allows you to proactively help them succeed at every step. Tools like Statisfy can help analyze these complex data points, offering insights that empower customer success managers to guide customers toward long-term success. It’s like having a seasoned gardener helping you nurture your plants to their full potential.
Let’s take a look at some examples of how different business types might approach their customer health scoring:
Essential Customer Health Score Metrics by Business Type Business TypePrimary MetricsWeight DistributionUpdate FrequencySaaS (Software as a Service)Feature Usage, Customer Support Interactions, Renewal Rate40%, 30%, 30%MonthlyE-commercePurchase Frequency, Average Order Value, Customer Lifetime Value30%, 30%, 40%WeeklyOnline Education PlatformCourse Completion Rate, Time Spent Learning, Community Engagement40%, 40%, 20%Weekly This table highlights how different businesses prioritize different metrics. For a SaaS business, feature usage is key, while for E-commerce, it’s all about purchase behavior. Online education platforms, on the other hand, focus on student engagement and progress.
By understanding these nuances and tailoring your metrics accordingly, you can create a customer health score that truly reflects the unique needs of your business and your customers.
Building Health Score Systems That Work in Practice
Imagine your customer success team navigating a vast ocean of data. They need a compass, something to guide them toward the customers who need their help the most. That compass is your customer health score. This section will guide you through building a scoring system that your team will actually trust and use, one that accurately reflects the well-being of your customer base. We’ll explore how to identify what success truly looks like for your customers, establish meaningful baselines, and create score ranges that trigger the appropriate actions at precisely the right moment.
Identifying Key Success Patterns
First, we need to understand what a healthy customer looks like. This isn’t about comparing yourself to industry averages, but about identifying the specific behaviors and outcomes that correlate with long-term value within your own customer base. Think about it like a doctor diagnosing a patient. They don’t just rely on general medical knowledge; they consider the patient’s individual history and symptoms.
What specific actions do your most successful customers take? Do they engage with particular features regularly? Do they follow a predictable onboarding path? Analyzing both quantitative data, such as product usage and support interactions, and qualitative feedback, like customer surveys and interviews, will reveal these crucial patterns. You can also find inspiration in similar fields, such as lead scoring best practices.
Establishing Meaningful Baselines
Once you’ve identified what success looks like, you need to establish baselines. This means setting realistic expectations for each metric, based on how different customer segments behave. A brand new customer will naturally have different usage patterns compared to a long-term subscriber. It’s like comparing the growth chart of a toddler to that of a teenager. Both can be healthy, but their growth trajectories will be significantly different.
What constitutes a “healthy” score versus an “at-risk” score for each segment? Defining these ranges requires careful analysis, and often involves some experimentation to find the right balance.
Creating Actionable Score Ranges
The real value of a customer health score lies in its ability to prompt timely action. Think of it like a traffic light system. Green means everything is fine, yellow signifies caution, and red demands immediate attention.
For each score range, define clear interventions. A low score might trigger a proactive outreach from a customer success manager, a personal check-in to see how things are going. A high score, on the other hand, could indicate an opportunity for upselling or expansion. These pre-defined playbooks ensure consistent and effective responses to changes in customer health, moving from reactive firefighting to proactive engagement.
Learning From Experience: What Doesn’t Work
Many companies make the mistake of overcomplicating their health score systems. They create incredibly complex formulas with dozens of metrics, thinking that more data automatically equals better insights. This can lead to analysis paralysis, where teams are overwhelmed by data and lose trust in the score itself.
Start simple. Focus on a handful of key metrics that truly predict customer outcomes. For example, simply tracking login frequency might give you a false sense of security. A customer could log in every day but not actually use the core features of your product. Instead, prioritize metrics tied to value realization, such as feature adoption and engagement with key workflows. This allows you to focus on the behaviors that truly indicate customer health and long-term success.
Test your approach and refine it over time based on feedback from your customer success team. This iterative approach will help you build a customer health scoring system that’s both accurate and truly actionable.
Choosing the Right Tools for Health Score Management
Picking the right tools for managing customer health scores can feel overwhelming. So many options, so many features… it’s easy to get lost. But the best choice isn’t about the fanciest software. It’s about finding the tool that fits your team’s current workflow and your specific needs. Think of it like choosing the right shoes – the best pair depends on whether you’re running a marathon or strolling through a park.
From Spreadsheets to Sophisticated Platforms: Finding the Right Fit
For some, especially those just starting with health scores, a simple spreadsheet might do the trick. If you have a small customer base and a few metrics, a spreadsheet is a quick, cheap way to track scores. It’s like using a notepad for a grocery list – perfect for a quick trip to the store. But as your customer base and scoring system grow, spreadsheets become difficult to manage and prone to errors.
That’s where dedicated customer success platforms like Gainsight or ChurnZero come in. These platforms offer automated data integration, customizable dashboards, and advanced reporting. They’re like upgrading to a smart fridge – automatically tracking what you need and alerting you before you run out. Industry research shows 79% of companies use dedicated software, while 14% still use spreadsheets. Keeping scores updated is vital, with 30% updating monthly and 2% annually. Discover more insights about customer health score usage.
Avoiding the Over-Investment Trap: Matching Tools to Maturity
A common mistake is overspending on tools before understanding your needs. It’s like buying a professional chef’s knife set when you only make toast. Start by defining your goals, identifying key metrics, and testing your scoring with a small group of customers. This helps refine your method before committing to a platform.
As your program grows, you can explore advanced tools with predictive analytics and automated workflows. This phased approach aligns your technology investments with your program’s growth, avoiding wasted resources.
Focusing on Essential Features: Separating Substance From Fluff
When evaluating tools, focus on features that truly matter for daily health score management. Look for smooth integration with your CRM (like Salesforce) and other data sources, customizable dashboards showing key metrics, and reporting that tracks progress and demonstrates impact. These empower your team to act and drive results.
Many platforms tout AI-powered predictions and complex algorithms. But these can be more hype than help. Don’t be fooled by flashy extras. Focus on the core functions that help you manage scores effectively and turn insights into action.
To help you compare some popular options, we’ve put together a table highlighting key features and pricing:
Customer Health Score Tool Comparison: Feature comparison of popular customer health score management tools and platforms Tool/PlatformKey FeaturesBest ForPricing RangeIntegration OptionsGainsightAutomated health score calculations, predictive analytics, workflow automationLarge enterprises with complex customer success needsContact for pricingSalesforce, HubSpot, ZendeskChurnZeroReal-time health alerts, customizable dashboards, playbooks for customer engagementB2B SaaS companiesContact for pricingSalesforce, HubSpot, SlackClientSuccessHealth score surveys, customer segmentation, account management toolsMid-sized B2B SaaS companiesContact for pricingSalesforce, HubSpotTotangoPre-built health score models, customer journey orchestration, multi-channel communicationStartups and growing businessesContact for pricingSalesforce, HubSpot, Slack This table offers a quick overview of some of the leading customer health score platforms. As you can see, each platform caters to different needs and budgets. Choosing the right one will depend on your specific circumstances. Remember to focus on your core requirements and avoid getting distracted by unnecessary features.
Turning Health Score Insights Into Customer Success Wins

Customer health scores are more than just numbers. They’re like a secret decoder ring for understanding your customer’s journey. Imagine being able to anticipate their needs and address their concerns before they even pick up the phone. That’s the power of effectively using customer health score insights. This section explores how successful customer success teams transform these scores from static data into dynamic conversations and proactive support.
From Numbers to Narratives: Using Health Scores to Spark Conversations
Think of changes in customer health scores as conversation starters. A dip in a score? That’s your cue to reach out. Not with an accusatory tone, but with genuine curiosity. Something like, “We noticed your usage of feature X has been down lately. Is everything okay? We’d love to help you get the most value out of it.” This simple check-in transforms a potential problem into a chance to strengthen the relationship. On the other hand, a rising score is an opportunity to celebrate their wins and explore how you can help them grow even further.
Let’s say a customer’s health score, specifically tied to a certain feature, suddenly drops. This is a golden opportunity for your customer success team to proactively connect, understand what’s happening, and offer personalized assistance. Maybe they’ve hit a snag they haven’t voiced, or perhaps they just need a refresher on using that feature effectively. This proactive approach demonstrates that you care and are invested in their success.
SaaS companies, for instance, frequently use customer health scores to increase customer lifetime value (LTV). They focus on metrics like adoption rates, product usage, and customer feedback. By carefully analyzing this data, they can develop tailored strategies for different customer segments, all based on their unique health scores. Learn more about optimizing customer health scores for SaaS businesses.
Playbooks for Success: Tailoring Actions to Different Score Ranges
Just as a doctor uses different treatments for varying degrees of illness, your customer success team needs different strategies for different health score ranges.
High Scores: These are your star customers. They’re thriving! Nurture them into becoming advocates. Offer exclusive content, early access to new features, or invitations to beta programs.
Mid-Range Scores: These customers are doing alright, but there’s room for improvement. Offer personalized training, introduce them to useful features they might not be aware of, or share success stories from similar customers.
Low Scores: These customers need your attention. It’s time for a rescue mission! First, understand the root cause of their low score. Is it a technical issue, a lack of product understanding, or perhaps a shift in their business needs? Once you identify the problem, offer targeted solutions and personalized support to help them get back on track.
Automating for Efficiency: Workflows That Empower Your Team
Automation isn’t about replacing human interaction. Think of it as giving your team superpowers, freeing them up to focus on those high-value conversations. Automated workflows can trigger alerts based on health score changes, automatically assign tasks to the right team member, and even send personalized emails or in-app messages. This ensures that no customer gets overlooked while empowering your team to build meaningful relationships. Platforms like Statisfy offer powerful automation capabilities, allowing you to customize workflows and ensure consistent, personalized customer experiences. This lets your team focus on what truly matters: building strong customer relationships and driving positive outcomes.
Proving the Impact of Your Health Score Program

Imagine launching a new product. You wouldn’t just hope it works, right? You’d track its performance, looking at sales figures, customer feedback, and market share. A customer health score program is no different. You need to demonstrate its value, showing how it contributes to the overall success of your business. Simply saying it feels right isn’t enough. You need solid data.
Measuring the ROI of Customer Health Initiatives
So, how do you prove the impact of your health score program? Think of it like measuring the success of any other business initiative. You need to focus on key performance indicators (KPIs). For a health score program, key metrics include retention rates, expansion revenue, and churn reduction. These metrics demonstrate the long-term effectiveness of your program.
Think of retention rate as a measure of customer loyalty. If your retention rate improves after implementing a health scoring system, that’s a good sign. It suggests your efforts are keeping customers engaged and satisfied.
Similarly, churn reduction is another crucial metric. Churn is the rate at which customers stop using your product or service. A decrease in churn, especially one that correlates with health score interventions, is strong evidence of your program’s value. Health scores can be very helpful for predicting and preventing churn. For a deeper dive into this topic, check out our article on strategies for predicting customer churn.
Leading Indicators: Predicting Long-Term Success
While metrics like retention and churn show past performance (lagging indicators), other metrics can offer insights into future success (leading indicators). These are the early warning signs, the subtle shifts that can predict long-term trends.
For example, imagine you see an increase in product usage among customers with high health scores. That could be a leading indicator of future expansion revenue. Similarly, positive customer feedback from those same high-scoring customers might predict stronger retention rates down the line. By tracking these leading indicators, you can anticipate positive trends and adjust your strategies accordingly.
Benchmarking and Best Practices: What Does Good Look Like?
You’ve got your metrics, but how do you know if they’re good? That’s where benchmarking comes in. Benchmarking involves comparing your performance against industry averages or your own historical data.
Let’s say the industry average for customer retention is 70%. If your program boosts your retention to 80%, that’s a significant win. Tools like Statisfy can help you track these metrics and benchmark against industry standards. They provide robust reporting and analytics features, making it easier to understand your performance and identify areas for improvement.
Building a Compelling Business Case: Speaking the Language of Executives
Finally, you need to communicate your results to stakeholders, particularly executives. When doing so, speak their language. Focus on the business value, not just the technical details.
Instead of saying, “We improved customer retention,” quantify your results. Say something like, “Our program led to a 10% increase in customer retention, resulting in an estimated $500,000 in additional revenue.” This data-driven approach makes your case more compelling and demonstrates the clear ROI of your customer health initiatives.
Your Health Score Implementation Roadmap
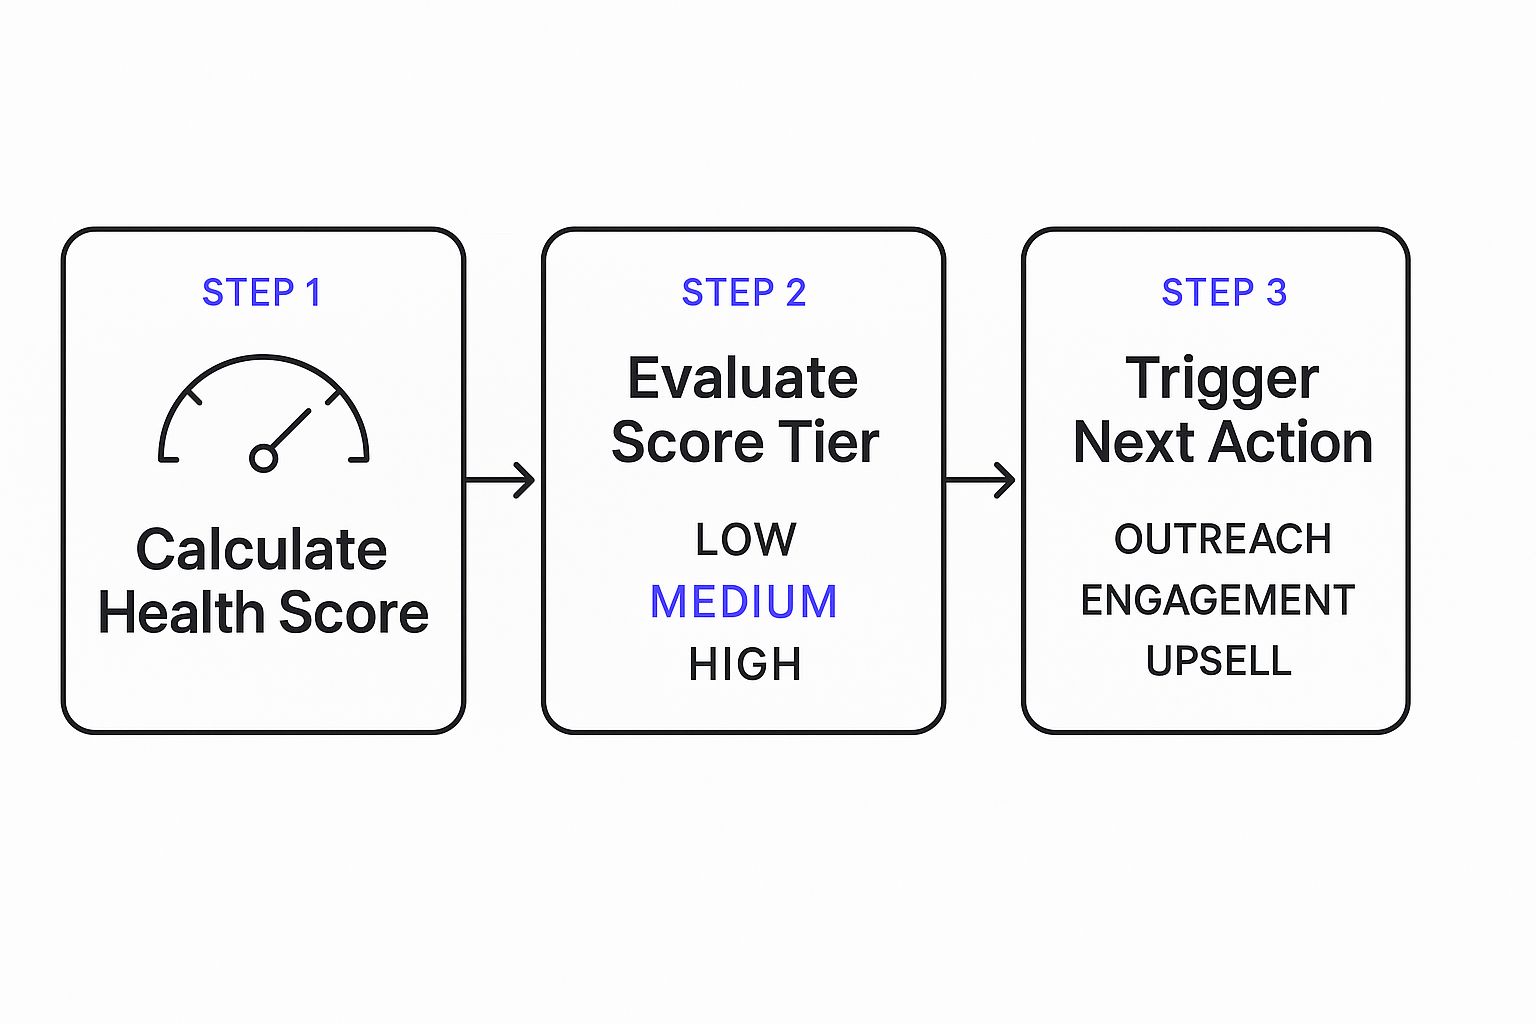
This infographic neatly visualizes the core process: calculating the score, evaluating its tier, and deciding on the next best action. It shows how you can go from raw data to actionable insights that improve your customer relationships. Implementing customer health scores is a journey, not a destination. Think of it as a continuous process of refinement and adaptation. Whether you’re just starting out or looking to revamp your current system, this phased approach will help you get there. We’ll cover the necessary steps, offer realistic timelines, and guide you on how to bring your team on board.
Phase 1: Piloting Your Approach
Think of this initial phase as a test run. Start with a small, representative group of customers. This pilot program lets you test your metrics, tweak your scoring system, and catch any unexpected bumps in the road in a controlled environment. It’s like testing a new recipe – you wouldn’t serve a dish to a crowd without trying it out first! During this pilot phase, work closely with your customer success team to gather feedback and make necessary adjustments. A timeline of 4-6 weeks is usually a good starting point for this.
This pilot phase is where you test your metrics, scoring methodology and see what unexpected challenges or insights you might uncover.
Phase 2: Expanding and Refining
Once the pilot program is complete, it’s time to gradually roll out your customer health scores to a larger customer segment. This expansion gives you more data, which in turn helps you further refine your metrics and scoring ranges. Think of it as adjusting the recipe based on feedback from your initial taste testers. Regularly check in with your team, looking for areas of improvement and ensuring the scores truly reflect customer health. This phase might take 2-3 months, depending on your customer base and team’s capacity.
The second phase brings you more valuable data, allowing you to make more precise adjustments to improve the scoring criteria.
Phase 3: Company-Wide Adoption and Scaling
With a successful expansion under your belt, it’s time for company-wide adoption. This involves training all relevant teams on how to use and understand the health scores. The key here is creating a cultural shift. Everyone needs to understand the importance of customer health and how these scores contribute to the bigger picture of success. As your company and customer base grow, your health score program needs to keep pace. Regularly review and adjust your system to make sure it stays aligned with your evolving business goals.The wider adoption of customer health scores at a company level will enhance the overall focus on retention and satisfaction.
Creating a Culture of Customer Health
Implementing a successful customer health score program isn’t just about the numbers; it’s about creating a culture that prioritizes customer success. This means getting everyone on board and making sure they understand the value.
Team Buy-in: Make sure everyone understands the “why” behind the program. What’s the overall goal? How does it benefit everyone?
Ongoing Training: Regularly train your team on how to interpret and act on the scores. This is not a one-time thing – continuous learning is essential.
Open Communication: Encourage open communication and feedback on how the program is working. Create a space where people can share their insights and suggestions.
By building a culture of customer health, you empower your team to address customer needs proactively, prevent churn, and drive long-term growth.
Ready to elevate your customer success with AI-driven insights? Explore Statisfy today and discover how our platform can help you automate customer management, personalize interactions, and unlock the full potential of your customer relationships.