
The Customer Retention Rate Formula for Growth
By Navin Agrawal · Co-Founder & Head of AI, Statisfy
Before we jump into the math and break down the customer retention rate formula, let’s first get clear on why this number matters so much. Picture your business as a bucket you’re constantly trying to fill with water. New customers are the water flowing in, but customer churn is the hole in the bottom. Your retention rate tells you how good you are at plugging that hole.
Why Customer Retention Is Your True Growth Engine

It’s easy to get caught up in the chase for new leads. Many companies operate under the belief that customer acquisition is the only real way to grow. And while you certainly need new customers, focusing only on the top of your funnel is an expensive, and frankly, exhausting way to run a business. Your existing customers are a powerful—and often neglected—source of predictable revenue and stability.
Turning your attention toward retention isn’t just a feel-good strategy; it’s a smart economic move. It’s a direct measure of your company’s health, the loyalty of your customer base, and how well your product actually fits the market. A high retention rate is a clear sign that you’re delivering real value, which naturally leads to organic growth and healthier profits. For a deeper look, this complete success guide to the customer retention rate formula offers some great insights.
The Financial Power of Keeping Customers
The connection between keeping customers and making money is crystal clear. You’ve probably heard the stat that acquiring a new customer can cost five times more than keeping an existing one. That single fact alone points to a huge opportunity for becoming more efficient. Even small bumps in retention can have an outsized impact on your bottom line.
Research has shown that just a 5% increase in customer retention can boost profits anywhere from 25% to 95%. It’s a powerful reminder that the biggest opportunities for growth are often sitting right in your current customer list.
Retention and Churn: Two Sides of the Same Coin
You can’t really talk about retention without also talking about its opposite: churn. The two metrics are inseparable—they are two sides of the same coin and will always add up to 100%. If you have an 80% retention rate, your churn rate is automatically 20%.
This simple relationship gives you a perfectly balanced picture of what’s happening with your customers. Mastering this concept is one of the most fundamental things you can do to build a foundation for long-term, sustainable growth.
How to Calculate Your Customer Retention Rate
Figuring out your customer retention rate might seem a bit intimidating, but the truth is, it’s pretty straightforward. It’s really just a way to take a snapshot of a specific period—say, a month or a quarter—and see how many of your customers stuck with you. Think of it as a quick, powerful health check for your customer loyalty.
The formula gives you a clear percentage of the customers you’ve managed to keep over that time. With just three key numbers, you can instantly get a feel for how well your business is truly meeting customer needs. If you want to dig deeper, you can explore a detailed breakdown of this metric to see its full business impact.
The Customer Retention Rate Formula Explained
First things first, you need to decide on the time frame you want to measure. A lot of businesses calculate this quarterly because it lines up nicely with their financial reporting. But for faster-moving businesses, like e-commerce or SaaS, running the numbers monthly or even weekly can give you more immediate insights.
Once you’ve picked your period, you’ll use the standard customer retention rate formula:
CRR = ((E - N) / S) x 100
Let’s break down what each of those letters means so you know exactly what data to pull. It’s like telling a simple story with a clear beginning, middle, and end.
To make it even clearer, here’s a quick reference guide for each variable in the formula.
Customer Retention Rate Formula Variables
VariableWhat It MeansExample ValueS (Start)The number of active customers you had on day one of your chosen period. This is your starting line.1,000 customersE (End)The total number of active customers on the last day of the period. This includes everyone, old and new.1,150 customersN (New)The number of brand-new customers you acquired during the period. This is crucial to get an accurate count.250 customers The key is that you have to subtract the new customers (N) from your final count (E). Why? Because the whole point is to measure how well you held onto the customers you already had at the start.
This visual helps show the flow of the formula, from your starting customer base to the final calculation.
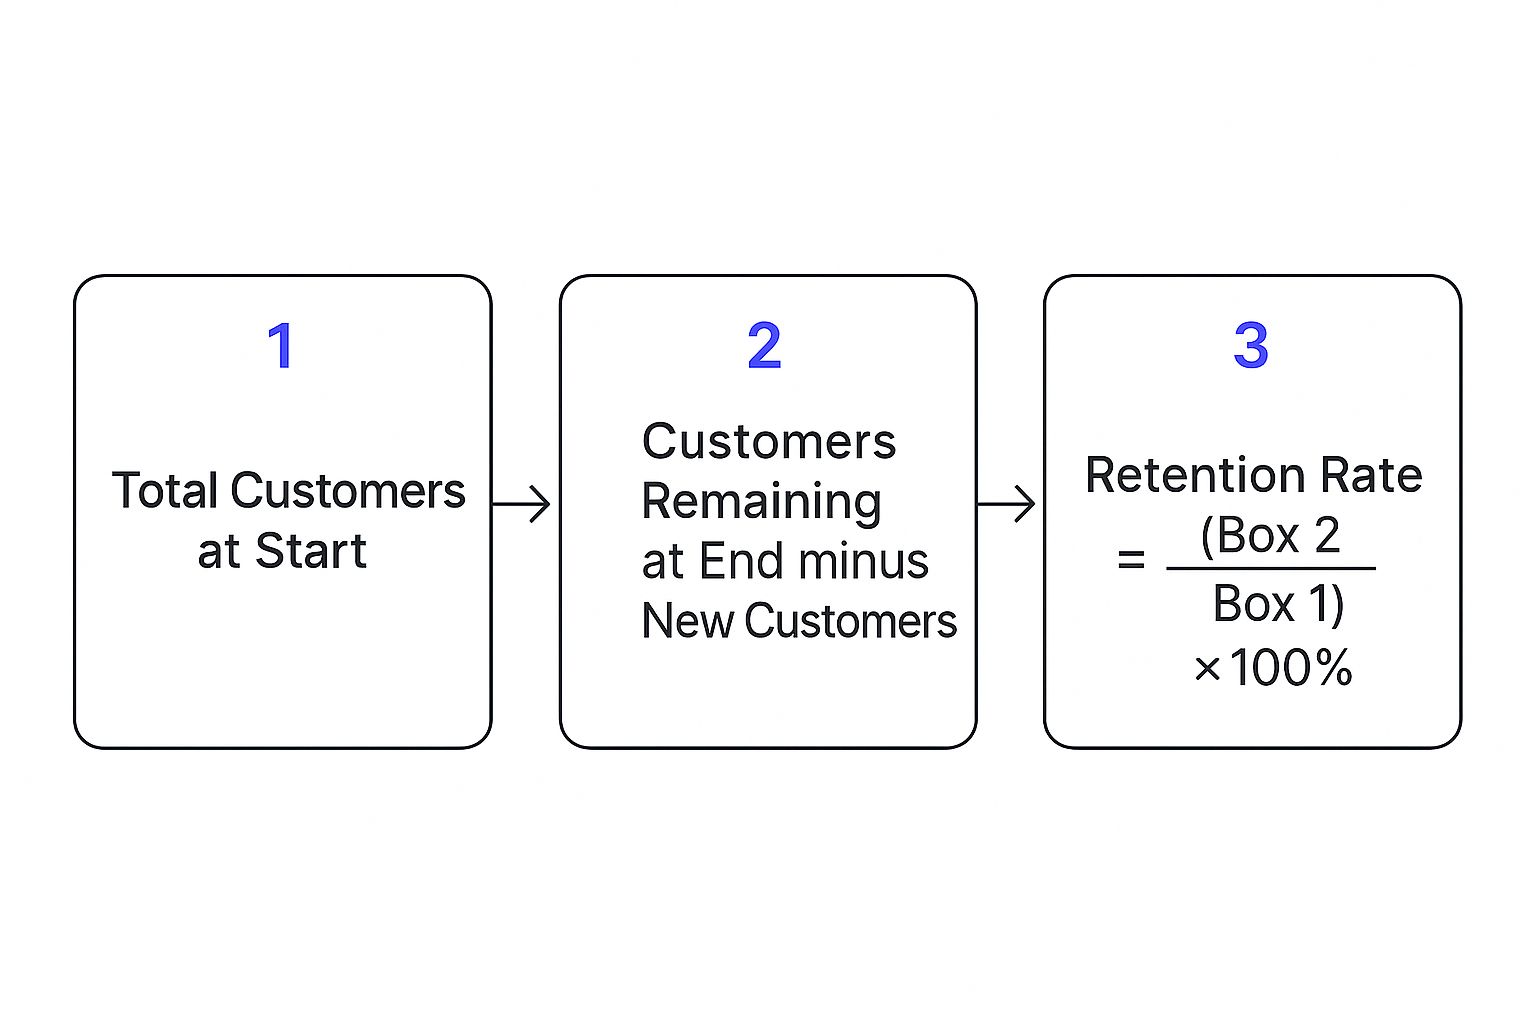
As you can see, it’s all about isolating that original group of customers who stayed with you for the entire ride.
A Practical Calculation Example
Theory is one thing, but let’s put the customer retention rate formula to work with a real-world scenario.
Imagine you run a subscription box service called “Crafty Crates.” You want to calculate your retention for the first quarter (Q1) of the year.
Here’s the data you’ve gathered:
- January 1 (Start of Q1): You had 1,000 active subscribers. This is your S.- March 31 (End of Q1): Your subscriber count grew to 1,150. This is your E.- During Q1: You ran a great marketing campaign and signed up 250 new subscribers. This is your N.
Now, let’s plug those numbers into the formula, step-by-step:
- 2. 3.
There you have it. Your customer retention rate for Q1 is 90%. That’s a fantastic number! It means you successfully kept 9 out of every 10 customers you started the quarter with.
What a Good Retention Rate Actually Looks Like

So, you’ve run the numbers and have your customer retention rate as a nice, clean percentage. Now what? The first impulse for many is to immediately hunt down a universal “good” number to measure against. But the reality is a bit more nuanced.
A good retention rate is almost entirely dependent on your industry. It’s just not fair to compare a SaaS company with annual contracts to a local coffee shop people visit daily. Their business models, customer expectations, and buying cycles are worlds apart. What’s considered a fantastic rate for one could spell trouble for the other.
Industry Benchmarks Matter
To get a real feel for your number, you need to look at what’s typical for your specific field. These benchmarks aren’t absolute laws, but they give you a solid frame of reference for setting goals and seeing how you stack up against the competition.
Here’s a rough breakdown of what you might see across different sectors:
- Media & Publishing: These companies often see rates somewhere between 25% and 50%. With an endless sea of content out there, keeping subscribers loyal is a tough gig.- Retail & E-commerce: A healthy rate here usually hovers between 55% and 65%. It’s worth fighting for, too—the average repeat retail customer spends 67% more after 31 months than they did in their first six.- SaaS (Software-as-a-Service): The bar is much higher in SaaS, where good retention is often between 80% and 95% for mature businesses. The entire subscription model is built on keeping customers for the long haul.- Finance & Insurance: These industries are frequently at the top of the leaderboard, with rates often exceeding 80%. This is largely thanks to high switching costs and the long-term nature of their contracts.
As you can see, perspective is everything. A retail business celebrating a 60% retention rate is likely doing great, but a SaaS company with that same figure would probably be in panic mode.
The Real Benchmark Is Yourself
Industry averages are a useful guidepost, but the most important benchmark is your own past performance. External numbers provide context, but your internal trends tell the true story of your company’s health.
The ultimate goal isn’t just to hit some arbitrary industry number. It’s to set your own baseline and then relentlessly focus on improving it, bit by bit. A 2% lift in your retention rate from one quarter to the next is a huge victory.
This is where tracking your CRR over time—monthly, quarterly, and annually—really pays off. It transforms a simple number into a powerful diagnostic tool. You can start to see if that new onboarding flow you implemented actually moved the needle, or if a recent price change started pushing people away. Your own history is what allows you to set meaningful goals and make smarter decisions for the future.
Looking Beyond Customer Count to Revenue Retention
A high customer retention rate is fantastic. It’s a clear signal that your business is healthy and that you’re delivering real value. But it doesn’t tell the whole story. What if the customers you’re holding onto are your smallest accounts, while the big fish are quietly swimming away? If you’re only counting logos, you might be missing a critical financial trend.
To get the full picture, you have to follow the money. This means shifting your focus from how many customers you keep to how much revenue you retain from them. It’s a subtle but powerful change in perspective.
This approach helps you answer a much more telling question: Is your existing customer base actually becoming more valuable over time?
Introducing Net Dollar Retention
The go-to metric for this deeper analysis is Net Dollar Retention (NDR), sometimes also called Net Revenue Retention. Unlike the standard Customer Retention Rate (CRR), which treats a $10/month customer the same as a $10,000/month customer, NDR tracks the total change in recurring revenue from your existing customers over a specific period.
Think of it this way: NDR accounts for all the financial ebb and flow within your customer base. It includes:
- Expansion Revenue: This is the good stuff—when customers upgrade, add more seats, or purchase new features.- Contraction Revenue: This happens when customers downgrade their plans or reduce their usage.- Churned Revenue: This is the revenue you lose completely when a customer cancels.
By bundling these upsells, downsells, and outright losses together, NDR gives you a far richer and more honest view of your company’s financial health and its potential to grow from the customers you already have.
The true power of NDR is that it can actually go above 100%. When that happens, it means your existing customers are generating more revenue than they were before, more than making up for any churn. An NDR over 100% is the gold standard, proving you have a strong, scalable business model.
How Net Dollar Retention Works in Practice
So, while tracking customer numbers is important, savvy companies also track revenue-based metrics. Net Dollar Retention is particularly powerful because it wraps expansion, contraction, and churn into one neat number, giving you a complete view of revenue health.
Let’s walk through a quick example. Imagine you start the month with $100,000 in recurring revenue from your existing customers.
Over that month:
- You gain $50,000 in expansion revenue (upgrades).- You lose $20,000 from contraction (downgrades).- You lose another $10,000 from customers who churned.
The NDR calculation would be: (($100,000 + $50,000 - $20,000 - $10,000) / $100,000) x 100 = 120%.
To dig deeper into the mechanics, you can learn more about how to calculate these retention rates and what they reveal about your business.
That 120% NDR is a fantastic result. It shows that the revenue you gained from happy, growing customers more than offset the revenue you lost from those who downgraded or left. This is a clear sign that your customer success efforts aren’t just plugging leaks—they’re actively driving growth. Ultimately, this is the goal: turning your loyal customers into their own, powerful revenue engine.
Common Mistakes That Skew Your Retention Data

On the surface, calculating your customer retention rate seems pretty straightforward. But a few all-too-common slip-ups can easily throw off your numbers, leading you to base important decisions on faulty data. Think of it like using a crooked ruler—your measurement might look like a number, but it’s fundamentally wrong. Bad data can mask serious issues or, just as dangerously, create a false sense of security.
The bedrock of a trustworthy customer retention rate formula is clean, consistent data. The most common error I see is surprisingly basic: mixing up the start and end dates. It is absolutely critical that your number of customers at the start of the period (S) and the number at the end (E) are pulled from the exact same point in time—the same day of the month, the same week of the quarter, etc.
If you don’t maintain that consistency, you’re essentially comparing apples to oranges. Measuring from the middle of January to the end of March isn’t a true quarter, and your results will be skewed.
Forgetting to Segment Your Customers
Another huge oversight is lumping all your customers together into one monolithic block. Sure, a single, company-wide retention rate is a decent health check, but it buries the most interesting stories your data has to tell. The real gold is found in segmentation.
Your overall retention rate tells you what is happening, but segmented rates tell you why. They reveal which customer groups are your biggest fans and which ones are quietly slipping away.
By calculating retention for different slices of your customer base, you can uncover powerful trends. You might discover, for instance, that customers who come from a particular marketing campaign have a phenomenal retention rate, giving you a clear signal on where your marketing dollars are best spent.
Ignoring Different Customer Cohorts
Start thinking about how you can slice up your data to answer bigger, more strategic questions. Here are just a few examples of segments worth digging into:
- By Acquisition Channel: Do customers who find you through organic search stick around longer than those from paid social media ads? The answer tells you where to double down on your acquisition budget.- By Pricing Plan: Are folks on your enterprise plan more loyal than customers on the basic tier? This can help you refine your pricing strategy and identify upselling opportunities.- By First Product Purchased: Do customers who buy Product A first have a better retention rate than those who start with Product B? This kind of insight can transform your onboarding flow and cross-selling strategy.
When you analyze these cohorts separately, your retention rate evolves from a simple report card into a powerful strategic tool. It helps you see what’s working, fix what isn’t, and put your resources where they’ll have the biggest impact on building a loyal customer base. Avoiding these common mistakes is the first step toward getting metrics that are accurate, insightful, and genuinely useful for growing your business.
Alright, you’ve calculated your customer retention rate. Now what? Knowing your number is one thing, but the real magic happens when you start taking steps to improve it.
This isn’t about just tracking a metric. It’s about actively building experiences that make customers want to stick around, turning that first purchase into a long-term relationship. The whole game is about reducing friction and boosting value every step of the way.
The first impression is everything. A clunky or confusing onboarding process is a surefire way to lose a new customer before they even get started. Your job is to get them to that first “aha!” moment as smoothly as possible. Think clear instructions, helpful pop-ups, and maybe a personal welcome that shows you’re paying attention.
After that initial welcome, your customer support team takes center stage. But it’s time to stop thinking of them as just a reactive problem-solving unit.
Building Proactive Customer Engagement
Think of your support team as your retention engine. When you handle an issue with speed and empathy, you’re not just fixing a bug—you’re proving to the customer they made the right choice. This is the service recovery paradox in action. Sometimes, a brilliantly handled problem can create a more loyal customer than if nothing had gone wrong in the first place.
A landmark study by Bain & Company really drives this point home. They found that a customer’s value skyrockets over time. In the apparel industry, for example, a repeat customer spent 67% more in their third year with a brand than they did in their first six months. This just goes to show the massive financial upside of keeping customers happy for the long haul.
To capitalize on this, you need systems in place for gathering feedback and making your loyal customers feel special.
- Create Feedback Loops: Don’t wait for customers to complain. Use simple tools like Net Promoter Score® (NPS) surveys to regularly check the pulse of your customer base. This lets you spot unhappy customers early and step in before they decide to leave.- Launch a Loyalty Program That Matters: Go beyond a simple punch card. Reward your best customers with exclusive access, special discounts, or points they can actually use. Give them a real, tangible reason to keep coming back.- Be Smart with Discounts: A well-timed “thank you” discount on a second purchase can work wonders. Pro tip: try offering store credit instead of a percentage off. It feels more like a gift and all but guarantees they’ll be back to spend it.
Putting these tactics into play turns retention from a vague idea into a solid plan. For a deeper dive into the specific tools and methods that can really move the needle, especially in the software world, checking out a modern guide to customer retention SaaS is a great next step. At the end of the day, every one of these strategies is a building block for creating a stronger, more loyal customer base.
Answering Your Top Retention Rate Questions
Even after you get the hang of the customer retention rate formula, a few questions inevitably surface once you start putting it into practice. Let’s tackle some of the most common points of confusion so you can use this metric like a seasoned pro.
How Often Should I Calculate Retention?
There’s no magic number here; the right frequency really hinges on your business model and how quickly things change. Think of it as choosing the right lens to view your customer base.
Here are a few common approaches:
- Monthly: This is the go-to for most SaaS, subscription, or e-commerce businesses. Customer behavior can shift fast in these industries, so a monthly check-in gives you quick feedback on whether your strategies are working or need a tweak.- Quarterly: A great middle-of-the-road option that smooths out any random monthly blips. It gives you a more stable trend line and often aligns perfectly with financial reporting cycles and strategic planning sessions.- Annually: This makes the most sense for businesses with very long sales cycles or yearly contracts. Think high-end enterprise software, consulting, or insurance. An annual calculation gives you that crucial big-picture view of loyalty over a significant period.
Can Customer Retention Be Over 100 Percent?
This is a fantastic question because the answer gets to the heart of what you’re actually measuring.
Using the standard Customer Retention Rate (CRR) formula, which is based on counting customer accounts (or “logos”), the answer is no. You can’t possibly end a period with more customers than you started with, so CRR is capped at 100%.
However, a cousin metric, Net Dollar Retention (NDR), can absolutely soar past 100%. This happens when the new revenue you generate from your existing customers—through upgrades, cross-sells, and expansions—outweighs the revenue you lose from customers who churn or downgrade. An NDR over 100% is a massive win; it means your business is growing healthily from your current customer base alone.
What Is the Difference Between Retention and Loyalty?
It’s easy to use these terms interchangeably, but they capture two very different things. I like to think of it this way:
Retention is a behavior—a customer simply continues to do business with you. Loyalty is an attitude—a customer genuinely likes your brand, recommends you to others, and wants you to succeed.
A customer might stick around because they’re locked into a contract or because switching to a competitor would be a huge pain. That’s retention, but it’s not loyalty. True loyalty is earned through trust, great experiences, and real value. The ultimate goal isn’t just to retain customers, but to transform that retention into genuine, enthusiastic loyalty.
Ready to turn retention data into proactive strategies? Statisfy uses AI to analyze your customer information, automatically identifying risks and opportunities so you can focus on building relationships that last. See how it works at Statisfy.