
How to Predict Customer Churn Before It Kills Your Business
By Navin Agrawal · Co-Founder & Head of AI, Statisfy
Understanding the Real Cost of Customer Churn in Your Business
Let’s talk about a tough subject: customer churn. It’s often treated as a simple line item—a lost subscription here, a canceled account there. But that view misses the bigger picture. The true cost isn’t just the direct revenue you lose; it’s the expensive, cascading problems that a departing customer leaves behind.
I remember working with a telecom company staring down a 30% annual churn rate. They were in a panic, realizing their marketing spend to acquire new customers was nearly six times higher than their more stable competitors. They were just running in place. Another time, a SaaS startup nearly collapsed because they wrote off their early churn as small bumps in the road, failing to see the financial and morale damage piling up.
The Hidden Ripple Effects of Losing a Customer
When a customer walks away, their recurring revenue goes with them. That’s the obvious hit. What’s less obvious are the hidden costs that really sting, which is why figuring out how to predict customer churn is so important.
The first domino to fall is usually the marketing budget. Your team has to spend more just to fill the gap, pushing your Customer Acquisition Cost (CAC) through the roof and shrinking your profit margins. But the damage goes beyond the balance sheet:
- It hits team morale hard: When sales and customer success teams watch their hard-won accounts vanish, it’s incredibly discouraging. This can lead to lower productivity and even cause your best employees to leave.- You miss out on growth: Every dollar spent replacing a lost customer is a dollar you can’t invest in developing new features, expanding into new markets, or delighting your loyal customers.- Your brand can suffer: A high churn rate can be a red flag to the market. It signals dissatisfaction, which can tarnish your reputation and make it tougher to attract the high-value customers you want.
Why Churn Isn’t One-Size-Fits-All
A “good” or “bad” churn rate is all about context. The acceptable level of churn and its financial fallout change completely depending on your industry. For instance, the financial services sector has a median customer churn rate of 19%, but in other global markets, that figure can shoot up to 30%. To build a predictive model that actually works, you have to account for these unique pressures. You can explore more industry-specific churn data to see how you stack up.
To put this into perspective, here’s a look at how churn rates and their associated costs can differ dramatically across a few major industries.
Industry Churn Rate Benchmarks and Impact Analysis
Comparison of churn rates across major industries with associated costs and retention strategies. IndustryAverage Churn RateCustomer Acquisition CostRetention Cost RatioKey Risk FactorsSaaS5-7% AnnuallyHigh5-10x Cheaper to RetainPoor onboarding, low feature adoption, competitive offersRetail20-25% AnnuallyModerate3-5x Cheaper to RetainBad customer experience, lack of personalization, priceTelecom20-30% AnnuallyVery High6-8x Cheaper to RetainNetwork issues, poor support, aggressive competitor pricing The common thread is clear: no matter the industry, keeping a customer is always significantly cheaper than finding a new one. The cost difference is often massive.
Once you calculate the true, all-in cost of a single lost customer for your specific business, the argument for investing in churn prediction becomes undeniable. It stops being an expense and starts being what it really is: a direct investment in your company’s stability and long-term growth.
Gathering Customer Data That Actually Predicts Churn
 Chances are, you’re already sitting on a mountain of customer data. But the real secret to figuring out how to predict customer churn isn’t about having the most data; it’s about having the right data.
It’s easy to get sidetracked by vanity metrics. Daily logins, for example, can feel reassuring, but they don’t tell the whole story. I’ve seen customers log in every single day out of pure habit, right up until the moment they hit the cancel button. Real prediction comes from looking deeper and spotting the subtle changes in how they behave.
Look Past the Obvious Engagement Metrics
The most valuable insights are often hiding in plain sight, in data points that might seem insignificant at first. For instance, an e-commerce client of mine perfected their churn prediction not by watching purchase frequency, but by flagging when a power user’s browsing suddenly shifted from exploring multiple categories down to just one.
Similarly, a B2B SaaS company I worked with found its “aha!” moment in customer service data. It wasn’t the number of support tickets that mattered, but the timing and sentiment behind them. A flurry of positive, feature-related questions is a world away from a single, frustrated ticket about billing.
To uncover these patterns, you need to combine three key types of data:
- Behavioral Data: This is what your customers do—how they use your product or service.- Demographic & Transactional Data: This is who your customers are and their purchase history.- Feedback Data: This is what your customers say in surveys, reviews, and support chats.
Build a Complete Customer Picture
These different kinds of data usually live in different places—your CRM, your analytics tool, your help desk software. The goal isn’t to cram everything into one giant database. Instead, you want to connect the dots to build a single, coherent story for each customer.
This complete view is especially important in tough markets. The telecommunications industry, for example, often faces annual churn rates that can climb past 30%. To fight this, top companies are combining operational data (payment history, service use) with experience data (customer satisfaction scores). This kind of advanced analysis is showing great promise for creating more accurate churn predictions by merging these separate data sources.
Spot the Real Red Flags
When your data starts talking, you can finally focus on the metrics that are true early-warning signs. Don’t get lost in the noise. It’s better to track a few high-impact indicators that show a relationship is going sour. Seeing the direct financial hit from a lost customer is why learning how to reduce customer churn is so crucial for any business.
Here are a few surprisingly effective metrics to keep a close eye on:
- A drop in feature use: When a customer stops using key features, especially ones they used to love, it’s a huge red flag. They’re no longer getting the same value.- A change in support tickets: A sudden jump in questions about billing, how to export their data, or contract terms is often a sign they’re planning their exit.- Fewer active users (for B2B): If you notice the number of active users from one company slowly dropping off, the entire account could be on the verge of churning.- Communication goes cold (or hot): A once-responsive customer who suddenly goes quiet is a warning sign. So is a sudden spike in complaints or negative feedback.
Spotting Early Warning Signs Before Customers Disappear
 Successfully predicting churn isn’t about reacting to a single, loud alarm. It’s about learning to hear the quiet whispers of a customer who is slowly drifting away. These small changes in behavior are the real treasure trove when you’re learning how to predict customer churn. Many companies miss these clues because they’re watching for lagging indicators, like a missed payment. By that point, the customer often has one foot out the door. The most valuable signals are usually hiding in your everyday engagement data.
Reading Between the Data Points
I once worked with a subscription service that was laser-focused on payment failures as their main sign of churn. Their big “aha!” moment came when they started looking at login data instead. They found that a customer’s login frequency dropping from daily to weekly was a 90% more accurate predictor of churn than a late payment ever was. The payment problem was just a symptom; the disengagement was the actual disease.
In a similar vein, a B2B software company I know discovered its most potent signal wasn’t in usage stats but in the phrasing of support tickets. Their prediction model learned to flag tickets where the language shifted from questions like, “How do I use feature X?” to inquiries like, “What is your data export policy?”. This change in conversation gave their team a heads-up weeks in advance, opening a critical window to step in and help.
The Power of Combined Signals
A single warning sign might be a fluke, but a combination of them points to a pattern. The real skill is in seeing how these signals connect and tell a story. For instance, a dip in feature usage could just mean a customer was on vacation. But, if that dip happens at the same time their email response time slows down, you have a much stronger indication that something is wrong. You’re looking for a narrative of disinterest to emerge from the data.
Here are a few powerful combinations to keep an eye on:
- Engagement & Support: A customer is using your core features less frequently while simultaneously opening more support tickets about billing or contract terms.- Activity & Communication: A previously active account goes dark, ignoring your check-in emails or in-app messages.- Usage Scope Reduction: A customer who once used a wide array of features now only logs in to use one or two, narrowing their activity significantly.
For the full list of signals worth tracking and the intervention sequence that follows them, see how to identify customers at risk of churning before they cancel.
Avoiding Alert Fatigue with Risk Segmentation
Of course, if you try to track every minor dip and fluctuation for every single customer, you’ll just create a mountain of noise and your team will suffer from alert fatigue. This is where smart segmentation is so important. You can build risk profiles that weigh a customer’s value against their specific churn signals.
For example, a high-value account showing just one red flag might immediately trigger a personal call from a Customer Success Manager. On the other hand, a low-value customer showing the same signal might get an automated email with a helpful guide. This strategic approach ensures your team’s energy is spent where it will have the greatest effect, turning your predictions into focused, meaningful action.
Choosing Prediction Models That Actually Work for You
When you first start to learn how to predict customer churn, it’s easy to get lost in a sea of complicated algorithms. It can be tempting to reach for the most powerful tool in the box, but the best model isn’t always the most complex one. The real goal is to find a model that gives you clear, actionable answers without needing a data science degree to understand it.
Start Simple, Win Often
For many businesses, the journey begins with Logistic Regression. There’s a reason it’s a trusted workhorse: it’s transparent, quick to implement, and great at sorting customers into simple “at-risk” or “safe” categories. Its biggest advantage is interpretability. You don’t just get a prediction; you see exactly which factors—like a drop in usage or fewer support tickets—are pushing a customer toward leaving.
This clarity makes it much easier to explain the “why” to your sales and customer success teams, giving them the information they need to step in. After all, a model that nobody understands is a model that nobody will use.
When to Add a Layer of Complexity
Of course, customer behavior isn’t always a straight line. Sometimes, you need something that can see around the corners. This is where models like Decision Trees and their more powerful cousin, Random Forests, come into the picture. A decision tree works a lot like we do, creating a flowchart of “if-then” questions from your data to land on a prediction.
Random Forests improve on this by creating an entire collection of these trees and then averaging their predictions. This approach delivers much higher accuracy and stability. These models are fantastic for uncovering non-obvious patterns. For example, a model might flag that customers who use Feature A but not Feature B and have been with you for less than six months are at an extremely high risk of churning.
To help you decide which path to take, let’s break down the most common models. This table compares them based on what matters most: accuracy, complexity, and where they truly shine.
Churn Prediction Model Comparison Guide
Detailed comparison of different prediction models with their strengths, limitations, and best use cases Model TypeAccuracy RangeImplementation ComplexityData RequirementsBest Use CasesLimitationsLogistic Regression70-85%LowStructured, labeled data. Works best with clean datasets.Baseline models, situations where explaining the “why” is critical, quick implementation needs.Struggles with complex, non-linear relationships; less accurate than other models.Decision Trees75-90%MediumHandles both numerical and categorical data well.Visualizing decision rules, feature importance identification, easy to explain.Can easily overfit to the training data, leading to poor new data performance; can be unstable.Random Forests85-95%+HighBest with larger datasets; can handle missing values effectively.When high accuracy is the top priority; situations where a “black box” model is acceptable.Difficult to interpret individual predictions; requires more computational power and time to train.Gradient Boosting90-97%+Very HighNeeds large, high-quality, structured datasets for best performance.Competitive scenarios where maximum accuracy is needed; fine-tuning for performance gains.Highly prone to overfitting if not carefully tuned; requires significant expertise and resources. As you can see, there’s a clear trade-off. More advanced models like Random Forests can definitely increase accuracy, but you lose the simple, straightforward story that Logistic Regression can tell. For a deeper walkthrough of how these approaches perform in production, see churn prediction models that actually boost customer retention.
A key part of any model is knowing which features hold the most predictive power. The following chart shows a common breakdown of feature importance when you are trying to predict customer churn.
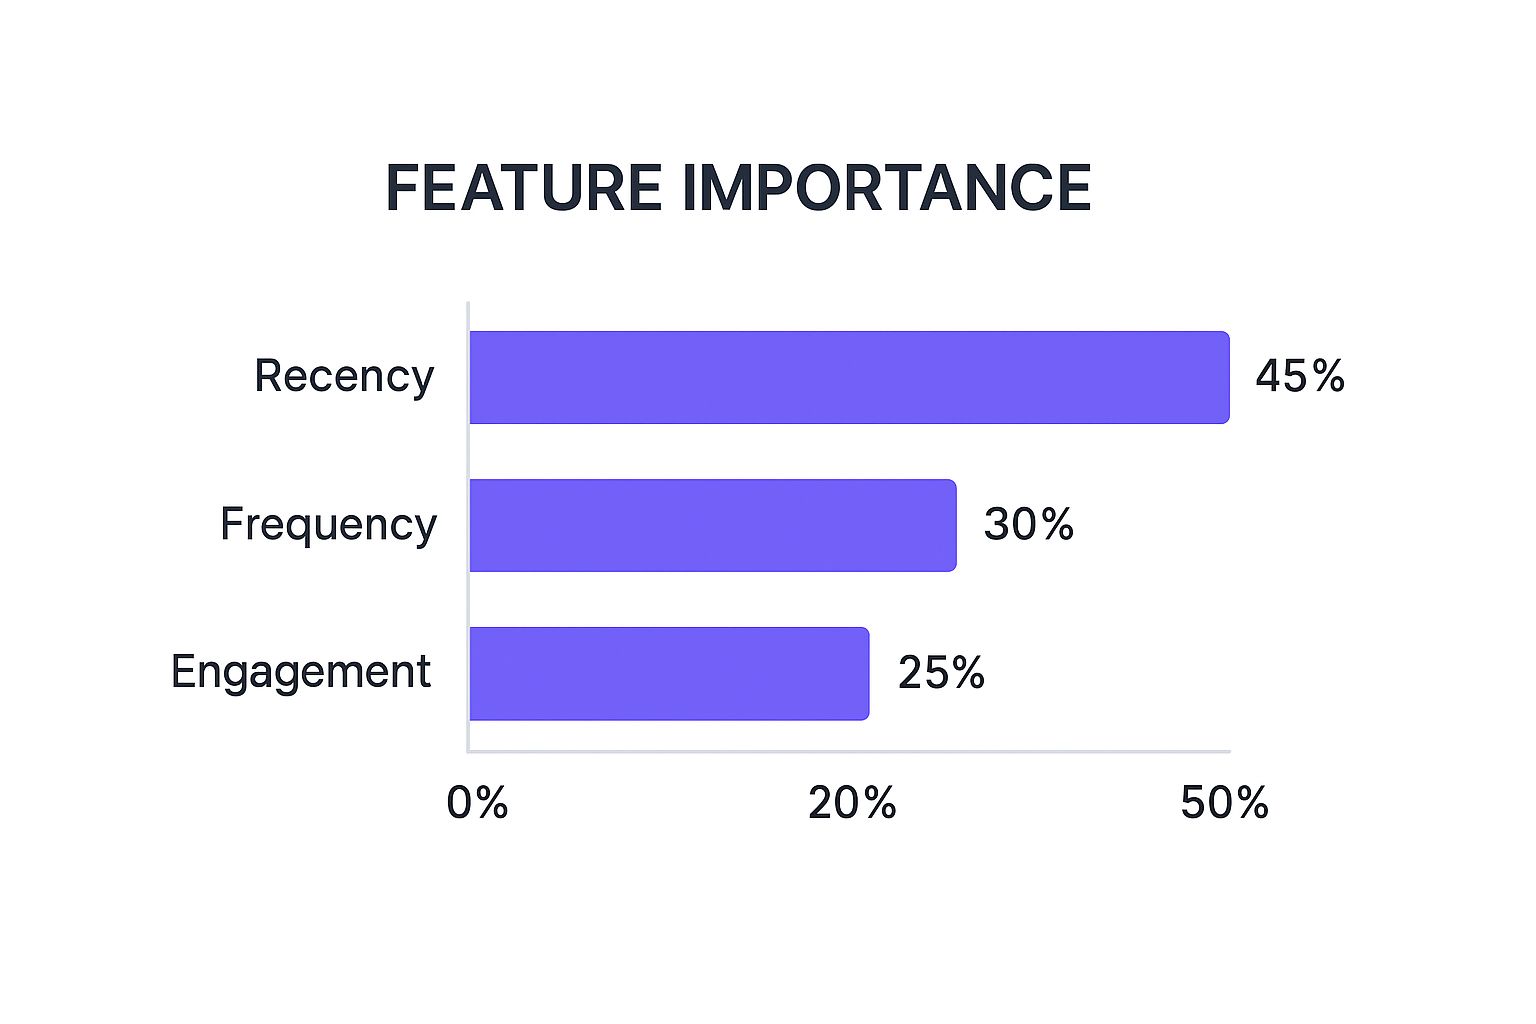
This shows that a customer’s recency—how recently they interacted with your business—often carries more weight than how frequently they buy or how engaged they are overall.
Sometimes, the strongest churn signals come from outside your own data. A sudden increase in negative online reviews can be a huge red flag, especially for service-based businesses. Identifying these at-risk customers early allows you to use proactive hotel reputation management to turn a bad experience into an opportunity to build loyalty.
Ultimately, your choice of model should be a practical one. Start with the simplest approach that gets the job done. Only introduce more complexity when you have a clear business need and the resources to support it. The best model is one that is understood, trusted, and used to save customers.
Implementing Prediction Tools Without Breaking Your Budget
Lots of teams assume that predicting customer churn requires a huge budget and a dedicated data science department. I’m here to tell you that’s a myth. Real success doesn’t come from having the deepest pockets; it’s about making smart choices and finding tools that match your specific business needs and can grow with you.
Finding the Right Fit for Your Business
The perfect tool for a massive enterprise is probably way too much for your needs. I’ve seen a mid-size retailer get fantastic results by simply connecting their CRM data to an affordable analytics platform. They used what they already had to get powerful insights on how to predict customer churn without a massive, expensive project.
On the other hand, a growing SaaS company I know needed a solution that would grow with them. They opted for a specialized churn tool that offered usage-based pricing. This allowed them to start small and scale their investment as their customer base expanded, keeping them from paying for features they wouldn’t need for another two years.
Evaluating Your Options Wisely
When you’re looking at different tools, it’s easy to get distracted by flashy dashboards. My advice? Focus on practical value. Don’t just sit through a demo; insist on a trial that uses a real segment of your own customer data. This is the absolute best way to see if the predictions actually make sense for your business.
Prioritize these things during your evaluation:
- Ease of Integration: How much of a headache will it be to connect your existing systems?- Clarity of Insights: Does the tool give you clear, actionable advice, or just another pile of data to sort through?- Pricing Transparency: Make sure you understand the full pricing model to avoid any surprise bills down the road. Find out if you’re being charged per user, per contact, or by data volume.
Platforms like Salesforce Analytics are designed to turn complicated data into visual stories with their dashboards.

A dashboard like this directly ties churn risk to financial impact, which makes it incredibly easy for anyone on the team to understand exactly what’s at stake.
The market for these tools is booming for a good reason. The global customer churn software market was valued at around $1.5 billion in 2023 and is projected to reach $4.8 billion by 2032. This growth, especially in North America where the market is expanding at a 12.5% CAGR, is driven by fierce competition in retail, finance, and tech. The increasing use of AI is making these tools more powerful and accessible, which is great news for businesses of all sizes. Discover more on the expanding churn software market.
This expanding world of churn prediction means you have more options and better pricing than ever before. From simple CRM plug-ins to powerful standalone platforms, a solution is out there. The key is to start with a very clear idea of the problem you’re trying to solve. Focus on a tool that provides actionable insights to help you save your next customer, not one that promises to do everything at once.
Turning Predictions Into Customer-Saving Actions
Getting a heads-up that a customer might leave is a great start, but it’s only half the job. The real value comes from turning that prediction into a timely, specific action that can save the relationship. A prediction without a plan is just a number on a dashboard; this is where you stop watching and start influencing customer loyalty.
From Confidence Scores to Action Thresholds
Your churn model won’t just give you a simple “yes” or “no.” Instead, you’ll get a confidence score—a percentage showing the likelihood that a customer will churn. The trick is figuring out what to do with these scores. Setting clear action thresholds is essential to prevent your team from chasing down every minor fluctuation.
Think about creating a tiered response system. For instance:
- High-Risk (85%+ score): These are your code-red situations. A score this high should trigger an immediate, high-touch response, like a personal phone call from a dedicated customer success manager.- Medium-Risk (60-84% score): This group is on the fence. An automated but personalized email with a helpful guide, a special offer, or an invite to a relevant webinar could be the perfect nudge to bring them back.- Low-Risk (<60% score): For these customers, no urgent action is needed. Keep an eye on them and include them in your standard marketing and communication flows.
This kind of segmentation helps you point your most valuable resources where they’ll make the biggest difference.
Turn confidence scores into action automatically
Start a free trial and let Statisfy route each flagged account to the right playbook — a CSM call for your highest-risk logos, an automated nudge for the rest.
Matching Interventions to Churn Drivers
The right action depends entirely on why a customer is at risk of churning. A generic “we miss you” discount won’t help someone who is frustrated with a specific product feature. Personalization is your most powerful tool here. I once saw a B2B company get a 300% higher success rate with personalized outreach compared to their old, generic offers. Instead of a discount, they sent a targeted email from a product expert offering a one-on-one session to walk through the exact features the customer had stopped using.
In another case, a subscription box service boosted its retention by 40% by creating different intervention paths. Customers flagged for low engagement received guides and tips to get more value, while those with payment issues were sent to a streamlined billing portal with a dedicated support chat.
Automating Your Retention Engine
As you grow, manually tracking and responding to every churn signal becomes impossible. This is where automated workflows are a lifesaver. You can set up rules in your CRM or customer success platform to trigger the right action at the right time. For example, you can use AI to scale your outreach without losing that personal touch. Tools like Marlie AI’s affordable AI phone agent service can automate personalized calls to your high-risk customers, making sure no one falls through the cracks. This frees up your human team to focus on more complex, strategic conversations.
Measuring and Refining Your Approach
The final, crucial piece is creating a feedback loop. How do you know if your interventions are actually working? You have to measure their impact. Run A/B tests on your retention offers. Compare the churn rate of customers who received an intervention against a small control group that didn’t. This data is gold. It not only proves the ROI of your retention efforts but also gives you the insights needed to constantly improve your strategies, making your churn prediction system smarter and more effective over time.
Building a Churn Prediction System That Lasts
It’s easy to think that once you’ve built a churn prediction model, the job is done. But in my experience, that’s just the beginning. A model that sits on a digital shelf is just a vanity project. The real goal is to create a living system that becomes a core part of your business operations.
Turning your insights on how to predict customer churn into a lasting advantage means building processes that can adapt to new products, shifting markets, and evolving customer needs. It requires taking the model out of the data science lab and putting it into the hands of your front-line teams.
From Project to Process: Aligning Your Teams
An accurate model is worthless if its predictions stay locked away in a dashboard. The magic happens when you create alignment across different departments. I once worked with a fast-growing e-commerce company that nailed this by creating a shared workflow around their churn scores.
When a customer was flagged as high-risk, it wasn’t just another notification. It set off a coordinated response:
- The marketing team immediately paused any aggressive sales ads for that specific user.- The support team got an alert to schedule a proactive “wellness check” to see if everything was okay.- The customer success team was prompted to review the account and look for intervention opportunities.
This kind of teamwork prevents different departments from working against each other—like marketing sending a discount offer while support is trying to resolve a serious complaint. It transforms a simple prediction into a unified, company-wide retention strategy.
Keeping Your Model Relevant and Reliable
Your customers change, and your product does too. A model built on last year’s data might completely miss the churn signals of today. This is a classic case of model drift, where a model’s predictive power decays over time.
I remember a SaaS business that developed a brilliant habit. Every time they released a major new feature, they scheduled time to update their model. They wanted to see if the adoption of that feature was a new indicator of customer loyalty.
To avoid being blindsided by model drift, you need a regular maintenance schedule. A practical rhythm could look like this:
- Quarterly Performance Reviews: Check how your model’s predictions stack up against actual churn data. Is it still accurate?- Semi-Annual Feature Evaluation: Re-assess which data points are most predictive. Have new customer behaviors become more important than old ones?- Continuous Data Quality Monitoring: Make sure the data feeding your model is still clean and reliable. Garbage in, garbage out.
Proving Its Worth and Ensuring Buy-In
Finally, a system like this needs ongoing support to survive, especially as leadership changes. To keep everyone bought in, you have to prove its long-term ROI. Don’t just report on the number of customers you “saved” this quarter.
Instead, track the lifetime value of the customers you retained through your efforts. When you can demonstrate that these saved customers go on to become some of your most loyal and valuable accounts, you’ll secure the resources needed to keep the system running for years to come.
Building and maintaining such a powerful system takes a lot of coordination. Tools like Statisfy are designed to handle the heavy lifting, using AI to automate data integration, model monitoring, and insight generation. This ensures your churn prediction efforts are not only accurate but truly sustainable.
Start a free trial to see what a churn prediction system built on your own data looks like — no data science team required.
Stop letting churn prediction stay a spreadsheet exercise
Start a free trial and connect your CRM, product, and support data. Statisfy will build the model, watch the signals, and tell your team who to call first.