
Reducing Customer Churn: Your Complete Growth Strategy Guide
By Munish Gandhi · Founder & CEO, Statisfy
The Hidden Costs That Will Shock You
Let’s be honest, reducing customer churn is a big deal. Most companies fixate on the immediate lost revenue, which is a problem, sure. But in my experience, the real damage runs much deeper. I’ve seen businesses underestimate the true impact by a shocking 300-400%. Think of it like a slow leak, silently draining your profits.
One major hidden cost? Customer acquisition. You spend a ton on marketing, sales, and onboarding new customers. Every lost customer means reinvesting those resources – essentially paying twice for the same outcome. It’s a vicious cycle, pulling money away from growth and innovation.
Your team’s productivity also takes a hit. Instead of nurturing existing clients and growing accounts, they’re scrambling to replace lost ones. This not only impacts efficiency, but also team morale. Constantly rebuilding instead of moving forward is incredibly frustrating.
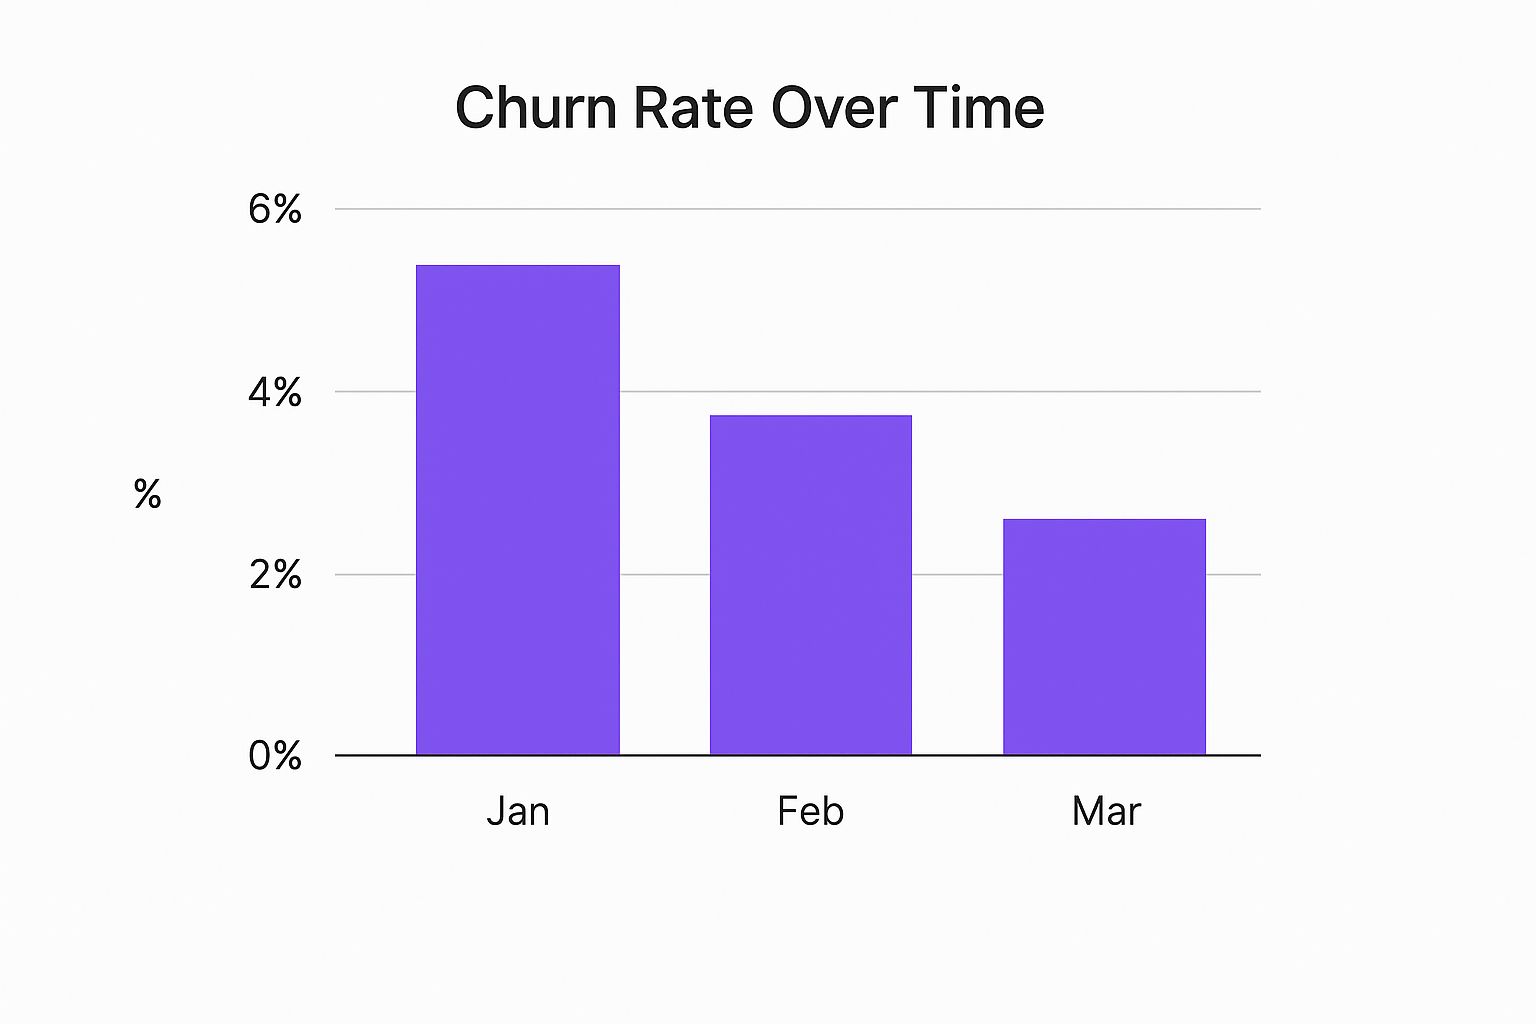
The infographic above shows monthly churn over the first quarter. Notice how even small monthly dips add up to a significant cumulative impact? This underscores the importance of consistent monitoring and proactive intervention.
Another often-overlooked factor is your brand reputation. Lost customers can lead to negative word-of-mouth and online reviews, making it harder to attract new business. This is especially damaging in industries with high customer lifetime values. Losing even a few key accounts can trigger a ripple effect.
Benchmarking Your Churn
To understand where you stand, it helps to compare your performance against industry averages. The table below provides a snapshot of churn rates and retention benchmarks across different sectors.
Industry Churn Rates and Retention Benchmarks IndustryAverage Churn RateRetention RatePrimary ChallengeHospitality20%55%Demand fluctuations, evolving customer expectationsMedia84%Professional Services84% As you can see, industries like hospitality face significant retention challenges, while others, such as media and professional services, boast much higher rates. This highlights the importance of tailoring your retention strategy to your specific industry context. More on customer retention strategies can be found here.
U.S. companies lose an estimated $168 billion annually due to customer attrition. In 2024, the hospitality industry saw a 20% decrease in customer retention, making the problem even worse. They face unique challenges like fluctuating demand and changing customer expectations, contributing to their low 55% retention rate. To address this, focusing on customer experience and loyalty, like in the media and professional services industries (with 84% retention rates), is key.
Finally, let’s talk about lost lifetime value. It’s not just the immediate loss; it’s the potential future revenue that walks out the door with each departing customer. Ouch. This is particularly painful for subscription-based businesses reliant on recurring revenue. Calculating this lost lifetime value can be a real eye-opener.
Grasping these hidden costs is the first step to making a strong case for reducing churn. You need to secure the resources for effective retention strategies. It’s time to shift from constantly acquiring new customers to nurturing and retaining the ones you’ve already worked so hard to win.
Spotting the Warning Signs Before It’s Game Over
Forget fancy algorithms. Truly understanding how to reduce customer churn comes down to recognizing the subtle, often counterintuitive, shifts in customer behavior weeks or even months before they decide to leave. From countless exit interviews and working with retention teams across various industries, I’ve seen a clear pattern: the warning signs are rarely obvious.
Declining Engagement: More Than Just Numbers
One common mistake is focusing solely on lagging indicators like decreased logins or reduced purchase frequency. These are important, of course, but they’re often the result of disengagement, not the cause. You need to dig a little deeper. Are customers interacting less with your content? Are they opening emails but not clicking through? Have they stopped providing feedback or participating in community forums? These subtle changes often come before more dramatic drops in usage.
Let me give you an example. Imagine a SaaS customer who usually logs in daily and actively uses several features. Suddenly, they’re logging in less frequently and only using core functionalities. This could be a sign of growing dissatisfaction or a shift in their needs. Catching this early allows you to step in with targeted support or personalized recommendations before they completely lose interest.
Support Interactions: A Cry for Help
Another critical area is customer support. High support ticket volume is often seen as a negative, but it can actually be incredibly valuable for reducing churn. Look beyond the sheer number of tickets. What types of issues are customers raising? Are they experiencing repeated technical problems? Are they struggling with specific features? Are their support interactions becoming increasingly frustrated or negative?
These patterns can uncover hidden problems with your product, service, or onboarding process. One major, but frequently overlooked, cost of customer churn is the lack of automation in customer support. Think about the time and resources wasted on repetitive queries! Addressing these proactively can actually turn potential churners into your biggest fans. Consider the Hidden Cost of Not Having an AI Chatbot.
Understanding Industry Benchmarks
It’s essential to put your churn data into context within your specific industry. Improving customer retention involves understanding the nuances of churn rates across different sectors. For example, B2B SaaS companies face a particular challenge with an average churn rate of 3.5% predicted for 2025. This really highlights how important it is to distinguish between voluntary and involuntary churn so you can develop the right retention strategies. Voluntary churn, where customers actively choose to leave, is often linked to dissatisfaction with services, while involuntary churn might be due to billing issues or technical glitches. Companies in sectors like media and professional services have tackled these issues head-on by keeping high retention rates, showing just how valuable tailored customer experiences can be. Want to dive deeper into SaaS benchmarks? Check out this resource: Discover more insights.

By understanding these subtle warning signs and setting up systems to track them, you can shift from reactive firefighting to proactive intervention. The key takeaway here? It’s not just about collecting data; it’s about knowing what to look for and then acting on it. Remember, a customer asking for help is often giving you a second chance.
Creating Health Scores That Actually Predict Something
I’ve seen a lot of customer health scores, and honestly, most are just vanity metrics. They might look impressive on a dashboard, but they don’t really tell you anything useful about which customers are actually at risk of churning. Let’s ditch those superficial numbers and build something much more effective: a predictive system your team will actually trust and use.
Designing a Framework That Works
Building a truly effective health scoring system starts with deeply understanding your specific customer journey. What does creating value actually look like for your business? What are the key milestones that tell you a customer is on the path to success (or headed for the door)? By looking at what’s working for companies with exceptional retention, we can create a framework that truly aligns with how you deliver value.
This means going beyond generic metrics like product usage. How often a customer logs in is far less important than how they’re using your product. Are they engaging with the features that really drive value? Are they achieving their desired outcomes? Combining behavioral signals, engagement patterns, and business outcomes (like revenue or contract renewals) lets us build a much more nuanced and predictive scoring system. This gives you the “why” behind the numbers.
Tackling the Messy Reality of Data
Let’s be honest: customer data is rarely perfect. You’re going to deal with incomplete information, shifting customer behaviors, and evolving business models. All of this can make static health scores obsolete in a matter of months. That’s why your system needs to be flexible. Regularly review and refine your scoring criteria to make sure it stays relevant and accurate.
Here’s a quick example. Imagine you’re a SaaS company measuring feature usage. A new feature launch could significantly change how customers interact with your product. If your health score only looks at older features, you might mistakenly flag engaged customers as at-risk simply because they’re exploring the new functionality.
From Numbers to Action
A good health score isn’t just a number; it’s a call to action. What specific interventions will you take based on different score ranges? This is where a lot of companies miss the mark. They focus on creating the scores but forget to define the corresponding retention strategies.
For example, a low health score might trigger a proactive outreach from your customer success team, a personalized email with helpful resources, or maybe even a targeted offer. A medium score might suggest a different set of actions entirely. The key is to turn those abstract numbers into concrete steps that actually prevent churn.
To help illustrate how these health scores can be tailored to different business models, check out the table below. It breaks down key health factors and how their importance might shift depending on the type of business you’re running.
Customer Health Score Components and Weighting Health FactorSaaS WeightE-commerce WeightService Business WeightData SourceFeature Usage30%10%20%Product AnalyticsCustomer Support Interactions20%30%40%CRM, Support TicketsRevenue Growth50%60%40%Financial Data Notice how revenue growth is critical for SaaS and e-commerce, but a bit less so for service businesses, where strong client relationships are often the most important factor.
The goal here isn’t about achieving perfect scores. It’s about building a system that genuinely helps you retain your most valuable customers. Remember, reducing customer churn is an ongoing process, not a one-time fix.
Retention Campaigns That Feel Helpful, Not Desperate

Let’s be honest, most retention campaigns feel…a little desperate, right? Like a last-minute scramble to win back customers who are already halfway out the door. They often rely on discounts and that pleading “please-don’t-leave” vibe. But the companies that truly nail customer retention? They’ve flipped the script. They’re all about providing real value early on, building relationships that make leaving feel like a genuine loss, not a welcome escape.
The Power of Proactive Value
Think about it. Which is more appealing: a generic discount or a personalized upgrade that solves a problem you’re actually having? A loyalty program that feels transactional or one that fosters a sense of belonging? These proactive interventions build trust and show customers you get them.
For example, imagine you’re using a new software and struggling with a particular feature. Suddenly, the company reaches out with a personalized tutorial video and offers a free consultation. That’s not just helpful, it shows they care and reinforces the product’s value. That kind of proactive support makes all the difference.
The Psychology of Retention Messaging
Effective retention messaging isn’t about begging; it’s about reminding customers why they signed up in the first place. What problems are you solving? What value are you providing? Highlighting these benefits and reinforcing the positives can be incredibly effective.
Timing is also key. Bombarding a customer with offers the second they show signs of leaving can feel intrusive. Instead, anticipate their needs and offer support before they even realize they need it. That proactive approach builds trust and strengthens your commitment to their success.
Why Win-Back Campaigns Often Fail
Most win-back campaigns miss the mark because they focus on the wrong things: discounts and incentives, without addressing the real reason the customer left. They’re treating the symptoms, not the disease. A customer who churned due to poor customer service isn’t going to come back just for a discount. They need to see real change.
Think of it like a fractured relationship. A simple “I’m sorry” isn’t enough. You need to show you understand what went wrong and take steps to fix it. Customer retention works the same way. Address the underlying issues, and you’ll have a much better chance of winning them back.
Understanding True Value
Reducing churn isn’t about offering more; it’s about understanding what your customers truly value. Is it your product’s ease of use? Your amazing customer support? Your company’s commitment to sustainability? By identifying and reinforcing these key value drivers, you create a relationship worth sticking around for.
This means actively listening to your customers, gathering feedback, and analyzing their behavior. Use tools like Statisfy to understand customer health and identify potential churn risks. By combining AI-powered insights with your own intuition, you can create retention campaigns that actually feel helpful, not desperately clingy.
The Art of Winning Back Lost Customers

Let’s be honest, customer churn happens. Even when you think you’re doing everything right, some customers will still slip away. But here’s the thing: “lost” doesn’t have to mean “gone for good.” The companies that truly excel at retention know that winning back churned customers is a key part of the strategy. They’ve actually turned churn into an opportunity to create some of their most loyal customers. This isn’t about begging them to come back; it’s about strategically rebuilding those relationships.
Diagnosing the Real Reasons for Churn
Many win-back campaigns fall flat because they only address the surface-level reasons customers give for leaving. The truth is, the stated reason is rarely the whole story. Think about it – do you always give the complete, unfiltered reason for canceling a service? Most people don’t.
So, how do you uncover the real reasons? You have to dig a little deeper. Analyze past interactions, support tickets, product usage data – anything that might give you a clue. Look for patterns. For example, if a customer constantly complained about a missing feature, they probably churned because of an unmet need, not just because of the price. This deeper understanding is essential for creating a comeback strategy that actually works.
Crafting Comeback Offers That Resonate
Once you understand why a customer left, you can tailor your offers to address the root cause of their churn. Generic discounts rarely move the needle. Instead, offer solutions. If a customer left because of a missing feature, highlight that you’ve recently added it. If support was the problem, offer a dedicated account manager.
For SaaS companies, retention is everything. There are some really solid customer retention strategies out there that can make a big difference. I’ve seen firsthand how important the digital landscape is for SaaS retention. Software companies often retain only about 39% of users after one month and 30% after three months. That’s a tough reality. It highlights the challenge of keeping users engaged and underscores why reducing churn is so critical. You can see more about those user retention rates. Effective strategies I’ve seen include constant product updates, incorporating user feedback, and offering truly personalized support. Media and professional services companies tend to do a great job at this, boasting retention rates of 84%. Their focus on consistent, positive customer experiences really pays off.
Timing Your Recovery Efforts
Just like your initial outreach, the timing of your recovery efforts is important. Reaching out too soon can feel pushy, while waiting too long can make re-engagement feel impossible. Think about the customer’s lifecycle stage and the reason they churned.
A customer who just churned because of a billing issue might be open to a quick follow-up. But a customer who left months ago due to dissatisfaction will likely need more time and a more compelling reason to return.
Choosing the Right Channels
Different communication channels work for different customers. Personalize your approach based on the customer segment and how they’ve interacted with you in the past. A high-value customer might appreciate a personalized email or a phone call. A less engaged customer might respond better to a targeted in-app message or a social media ad.
Knowing When to Let Go
Here’s the hard truth: sometimes, a customer just isn’t worth winning back. The cost of recovery might be more than their potential lifetime value. Recognize these situations and focus your energy on keeping your best customers happy. This strategic approach maximizes your ROI and makes sure you’re not throwing good money after bad.
Making Technology Your Retention Secret Weapon
Technology can revolutionize your approach to customer retention. But it’s easy to get lost in the hype. The real trick? Blending AI-powered insights with human intuition. I’ve seen firsthand how this creates interventions that feel personal, not robotic.
Predictive Analytics That Actually Learn
Think of predictive analytics as your trusty assistant. It sifts through mountains of data to spot patterns you’d likely miss. But the real magic is when these systems learn and adapt. Forget static algorithms – you need tools that evolve with your customers and your business. This means finding solutions that handle messy, real-world data and still deliver valuable insights. Imagine a system that not only flags at-risk customers but also suggests specific actions based on what’s worked before. That’s the power of truly intelligent predictive analytics.
Automation That Enhances, Not Replaces
Automation is a game-changer for reducing churn, but it’s not about replacing human connection. It’s about freeing up your team to build those connections. Let automation handle the routine tasks – reminder emails, personalized resource suggestions based on usage – so your team can focus on building real relationships with key customers. Those are the conversations that build true loyalty.
Integration That Simplifies, Not Complicates
New technology shouldn’t create new problems. Seek out tools that integrate seamlessly with your existing systems. A messy, disconnected tech stack is a recipe for disaster. It’s like having a toolbox bursting with amazing tools but no organization – you’ll spend more time searching than building. Choose solutions that work with your current setup, making implementation smoother and ensuring your team actually uses the new technology.
Building vs. Buying: Knowing the Right Approach
Building your own retention tools can be tempting, but sometimes buying a pre-built solution is just smarter. There are some fantastic tools out there, like Statisfy, designed specifically for reducing churn. They offer powerful features, like AI-driven insights and automated workflows, without the headaches of building from scratch. Consider your resources, your needs, and your timeline. Sometimes, focusing on your core business and letting the experts handle the tech is the best path forward.
Evaluating Retention Technology: Beyond the Demo
Flashy demos can be deceiving. The true test of any retention tool is how it performs in the real world. Look for clear metrics and reporting so you can track progress and see the impact on your bottom line. Talk to other companies using the tool and ask for case studies. The best tools don’t just look good; they deliver measurable results.
Remember, the goal isn’t to automate everything. It’s about using technology strategically to supercharge your human retention efforts. It’s about combining the best of both worlds to create a winning strategy.
Measuring What Actually Matters for Retention Success
Numbers can be deceiving. I’ve seen so many companies focusing on the wrong data when it comes to keeping their customers happy. It’s like reading a story and only paying attention to the chapter titles – you miss the real plot. We need to ditch the vanity metrics and dig into the stuff that actually drives better decisions and builds stronger relationships. The most successful retention teams I’ve worked with all have one thing in common: they obsess over the metrics that truly matter.
Beyond Vanity: Metrics That Drive Action
Too many businesses get fixated on surface-level numbers like overall churn rate. Don’t get me wrong, it’s important, but it’s a lagging indicator. It tells you what already happened. What you really need are leading indicators – the metrics that predict future churn. Think about things like a dip in product usage, slower support ticket resolution times, or lower customer satisfaction scores. These are your early warning signs, giving you a heads-up before things go south.
Let’s say you see a particular customer segment suddenly using your key product features less and less. That’s a major red flag. It’s a golden opportunity to reach out proactively, offer support, or even tweak your features to better meet their needs. This is all about moving from reacting to problems to predicting and preventing them.
Building Dashboards That Tell a Story
Your dashboards shouldn’t just be a collection of pretty charts. They should tell a compelling story about your customer’s journey. This means organizing your data in a way that unlocks actionable insights. Instead of just showing the overall churn rate, break it down. How does churn differ across different customer types, acquisition channels, or pricing plans? This granular view can reveal hidden patterns and opportunities for targeted interventions.
For example, imagine you discover that customers acquired through a specific marketing campaign churn at a much higher rate. This could indicate a problem with the campaign’s messaging or the onboarding process for those customers. See? Actionable insights.
Leading, Lagging, and Middle Metrics
Think of your retention metrics like a three-act play. Leading indicators set the stage, predicting future churn. Lagging indicators, like overall churn rate and customer lifetime value (CLTV), reveal the long-term effects of your work. But the real action is in the middle. Middle metrics measure the effectiveness of your retention efforts in real time. Think about customer satisfaction scores after a support interaction or the conversion rate of a retention campaign.
These middle metrics let you fine-tune your strategies on the fly. If a specific campaign isn’t working, you can tweak the messaging, targeting, or timing based on this real-time feedback.
Measuring ROI and Securing Budget
To get your executives on board, you need to show them the return on investment (ROI) of your retention efforts. How much money are you saving by reducing churn? How does that compare to the cost of acquiring new customers? By putting a number on the impact, you build a strong case for continued investment.
Remember, reducing churn isn’t just a customer success thing; it’s a vital business strategy. By measuring the right things, you create a data-driven approach that not only keeps your customers happy but also drives sustainable growth. And trust me, from what I’ve seen, the results are absolutely worth it.
Your Immediate Action Plan for Retention Success
Okay, so we’ve covered a lot of ground. Now, let’s get down to brass tacks and map out a plan you can put into action today. This isn’t some pie-in-the-sky theory – it’s a practical roadmap built on real-world experience. I’ll walk you through where to focus your energy first for the biggest impact.
Prioritize Quick Wins
I always recommend starting with the easy wins. What small, manageable changes can you make right now to boost retention? Think about things like streamlining your onboarding, tweaking your welcome emails, or adding a simple automated feedback system. These quick wins create momentum and show the value of a retention-focused strategy. For instance, I’ve seen a simple personalized email welcoming a new customer and offering helpful resources make a huge difference in their early experience.
It’s about making those first interactions count.
Build a Solid Foundation
Long-term retention success means thinking about the bigger picture. Improving your overall customer service is a great place to start. Check out these customer service best practices for some solid advice. Beyond that, you need a reliable system for spotting at-risk customers. This could be as simple as a spreadsheet tracking key metrics or a more advanced AI-powered platform like Statisfy. The key is to have a clear picture of who’s likely to churn and why. This allows you to target your efforts effectively. In my experience, even implementing a basic customer health scoring system can yield amazing results.
Secure Stakeholder Buy-In
Let’s be honest, improving retention often takes resources: budget, staff, new tech. To get those resources, you need to get your stakeholders on board. The most effective way I’ve found to do this is to focus on the financial impact of churn. Put hard numbers to the lost revenue, the increased acquisition costs, and the hit to your bottom line. A clear ROI case is usually all it takes to get executives to sit up and take notice.
Create a Culture of Retention
Retention isn’t just something one department handles; it’s a company-wide mindset. Weave retention thinking into every part of your business. Encourage your team to think about the customer’s whole journey and how each interaction impacts their long-term loyalty. This means giving your front-line staff the power to proactively solve problems and celebrating retention wins as a team. When everyone’s focused on keeping customers happy, the results are undeniable.
Ready to give your customer retention a serious boost? Statisfy’s AI-powered platform helps you identify churn risks, automate important tasks, and build stronger customer relationships. Explore Statisfy and start your free trial today.