
Turn Data Into Actionable Insights: Your Complete Playbook
By Navin Agrawal · Co-Founder & Head of AI, Statisfy
Understanding What Makes Insights Actually Actionable

Many organizations collect large amounts of data. However, they often struggle to transform this raw data into actionable insights. Creating visually appealing dashboards isn’t enough. The true goal is to generate insights that directly inform and improve decision-making. This requires moving beyond surface-level vanity metrics and focusing on data that truly impacts business outcomes.
The ability to extract meaningful and actionable insights is proving crucial for businesses across diverse industries. The data analytics market itself is experiencing significant growth. It’s projected to expand from $74.83 billion in 2024 to $94.86 billion in 2025, demonstrating a CAGR of 26.8%. Factors driving this growth include the increasing volume of data available, rising demand for business intelligence, and the need for regulatory compliance. For more information on this market trend, you can explore the report from The Business Research Company.
Identifying Truly Actionable Insights
What distinguishes actionable insights from simply interesting data points? Actionable insights possess a clear connection to specific, measurable actions. For instance, observing a 10% increase in website traffic is interesting, but not inherently actionable.
However, discovering that this increase is primarily driven by a new marketing campaign targeting a particular demographic transforms the data into an actionable insight. This knowledge allows for adjustments to the marketing strategy, enabling businesses to further leverage the successful campaign’s impact.
Characteristics of Actionable Insights
Several key characteristics define truly actionable insights:
- Specificity: The insight pinpoints a distinct problem or opportunity.- Measurability: You can track the progress resulting from actions taken based on the insight.- Relevance: The insight aligns with the overarching business goals.- Timeliness: The insight is available at the moment it’s needed for decision-making.- Achievability: The actions suggested by the insight are realistic and within reach.
Avoiding Analysis Paralysis
Organizations can sometimes fall into the trap of analysis paralysis. This occurs when they become overly focused on data collection and analysis without actually taking any decisions. To prevent this, it’s crucial to define clear objectives before initiating any analysis.
Specifically, determine the questions you want the data to answer and the desired business outcomes. Focusing on the previously mentioned characteristics of actionable insights also helps maintain focus and avoid becoming lost in a sea of irrelevant data. This targeted approach ensures data analysis leads to tangible actions and not just more reports.
Transforming Data into Action: A Practical Example
Consider a customer success team at a SaaS company observing a recent uptick in customer churn. Simply knowing the churn rate is not enough. However, by analyzing the data further, they might discover that users who haven’t completed the onboarding process have a considerably higher churn rate.
This is an actionable insight. The team can then implement changes to optimize the onboarding experience, such as developing more intuitive tutorials or offering personalized support. By consistently applying this analytical approach, businesses can turn data into a competitive advantage, streamlining processes, and enhancing overall performance.
Building Your Data Analysis Foundation That Actually Works
Turning data into actionable insights requires a solid and effective data analysis foundation. Rather than relying on unnecessarily complex methodologies that often fail to deliver practical results, successful data teams use systematic approaches to consistently generate reliable insights. This begins with defining clear objectives before diving into the data.
Define Clear Objectives
It’s essential to establish exactly what you want to achieve with your data analysis. Ask yourself: What specific business questions are you trying to answer? What decisions are you hoping to inform? This initial step provides direction and focus, preventing aimless data exploration that yields little value.
Select Key Performance Indicators (KPIs)
Once you’ve established your objectives, the next step is identifying the Key Performance Indicators (KPIs) that will measure progress. For example, if your objective is to increase customer retention, relevant KPIs might include customer churn rate, customer lifetime value, or Net Promoter Score (NPS). Choosing the right KPIs is essential for measuring the effectiveness of actions taken based on insights.
Align Metrics to Goals
Finally, it’s crucial to ensure that the selected KPIs directly align with overarching business goals. This alignment ensures that the generated insights are not only relevant but also contribute to the overall success of the organization. For example, if a company’s primary goal is to increase revenue, analyzing website traffic alone might not be enough. Instead, focusing on KPIs like conversion rate or average order value provides more direct insights into revenue generation.
The following infographic illustrates this three-step process:
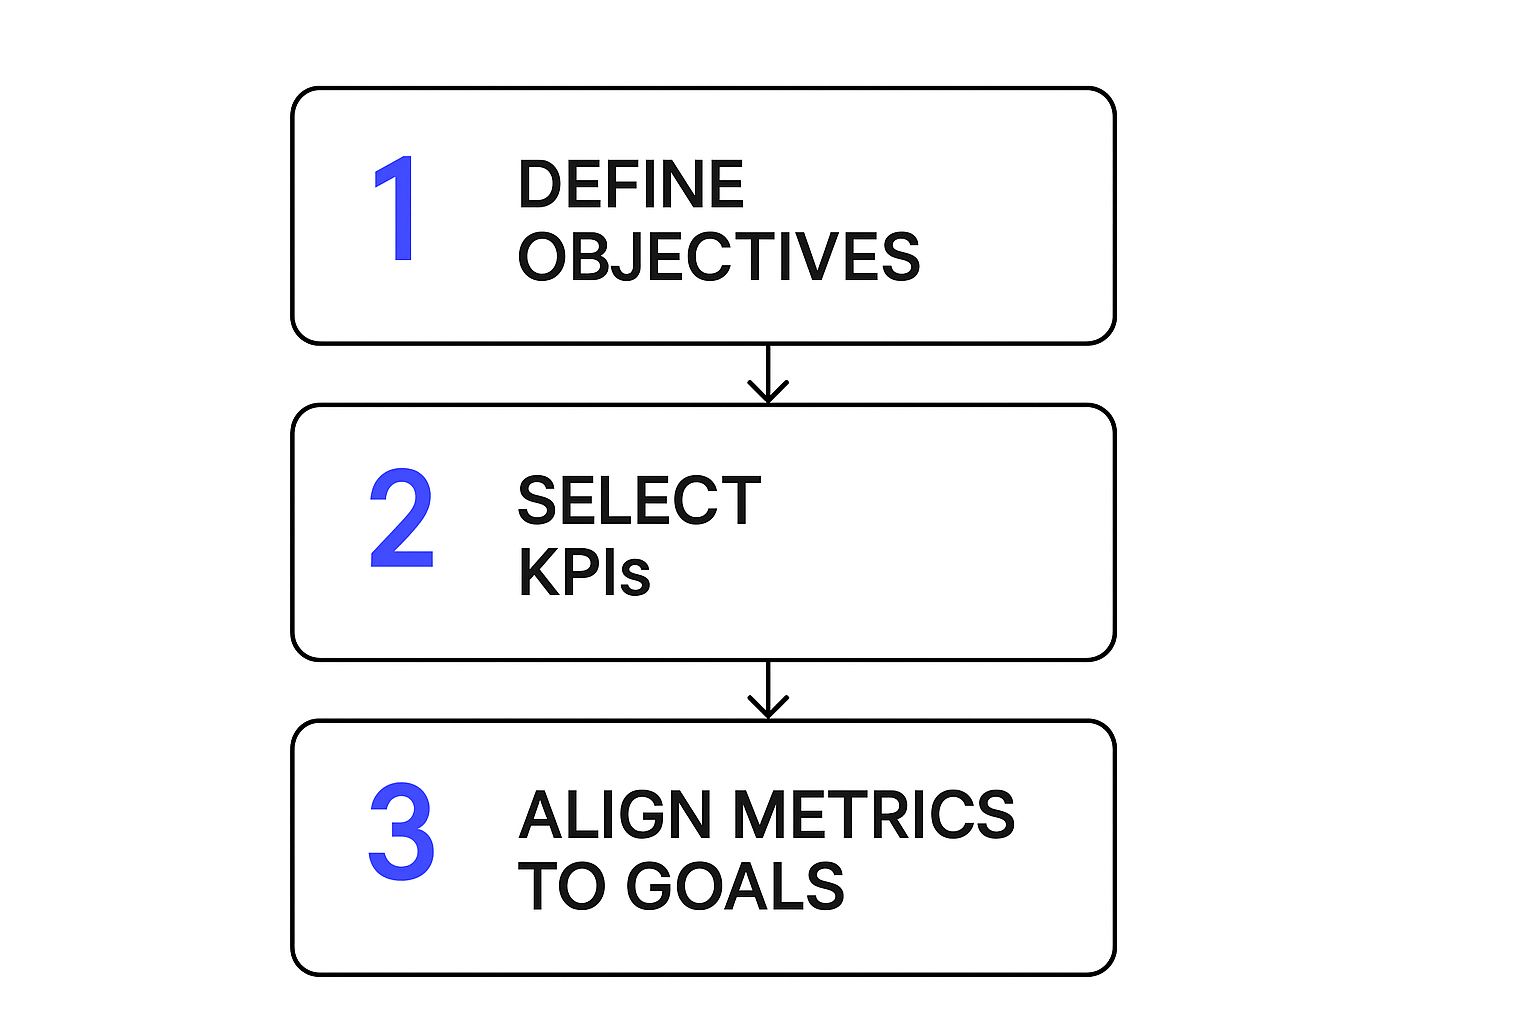
This infographic highlights the critical flow: define objectives, select KPIs to measure progress, and ensure these metrics contribute to business goals. This structured approach streamlines the data analysis process and maximizes the potential for actionable insights.
Ensuring Data Quality and Structure
With clear objectives and aligned KPIs, ensuring data quality becomes paramount. However, aiming for absolute perfection can be counterproductive. Focus on practical data quality checks that address potential issues without getting lost in minor imperfections. A systematic analysis process avoids common pitfalls and promotes reproducible workflows. This structured approach, combined with a focus on practical data quality, sets the stage for valuable insights. These insights, based on reliable data and aligned with clear objectives, empower organizations to make data-driven decisions.
Building Scalable and Reproducible Workflows
As your organization grows, your analytical processes must scale efficiently. Reproducible workflows are essential for this. This involves documenting every step of your analysis, from data collection and cleaning to analysis methods and interpretation. Using templates and checklists can significantly streamline this documentation process, ensuring consistency and facilitating team collaboration. Well-documented workflows enable new team members to quickly onboard and contribute, strengthening your organization’s analytical capabilities. Prioritizing scalable workflows ensures your data analysis provides continuous value as your organization evolves.
To understand different data analysis frameworks and how they fit into building a robust foundation, let’s examine a comparison of popular methodologies:
The following table provides a comparison of popular data analysis methodologies and their best use cases:
Data Analysis Framework Comparison FrameworkBest ForTime RequiredTechnical ComplexityBusiness ImpactDescriptive AnalysisSummarizing historical data and identifying trendsLowLowUnderstanding past performanceDiagnostic AnalysisDetermining the root cause of a problem or trendMediumMediumIdentifying problem areasPredictive AnalysisForecasting future outcomes based on historical dataHighHighProactive decision-makingPrescriptive AnalysisRecommending actions to optimize outcomesHighVery HighOptimizing business strategies This table summarizes the key characteristics of each framework, highlighting their strengths and weaknesses. By understanding these differences, you can choose the most appropriate framework for your specific needs and objectives. Ultimately, building a solid data analysis foundation allows you to extract meaningful insights from your data and make informed decisions that drive business success.
Harnessing AI for Deeper Business Insights
Turning data into actionable insights is essential for businesses today. A key driver of this shift is the integration of Artificial Intelligence (AI) and Machine Learning (ML). The global data analytics market is projected to reach $302,006 million by 2030, with AI-driven predictive analytics fueling a significant portion of this growth. Industries like healthcare and finance, with their increasing need for specific, tailored analytics, are at the forefront of this trend. For a more in-depth look at these statistics, visit Grand View Research.
How AI Enhances Data Analysis
AI and ML provide robust tools for uncovering hidden patterns and making predictions that are beyond the capabilities of traditional methods. This isn’t just about automating existing processes; AI empowers us to ask new questions and derive deeper meanings from our data. For instance, AI can analyze intricate customer behaviors to predict future purchasing decisions with remarkable accuracy. This, in turn, allows businesses to personalize marketing campaigns and optimize product offerings based on those predictions.
Practical Applications of AI in Business
The applications of AI in data analysis are varied and continuously evolving. Consider a retail company seeking to optimize its inventory management. AI algorithms can analyze historical sales data, current market trends, and even external factors such as weather patterns to forecast future demand. This allows businesses to maintain ideal stock levels, minimizing storage expenses and the risk of running out of stock.
AI-Driven Supply Chain Optimization
AI is also transforming supply chain management. By analyzing shipping data, logistical constraints, and supplier performance, AI can pinpoint potential bottlenecks and suggest optimized routes or alternative suppliers. This results in improved efficiency and significant cost savings. Imagine AI predicting an upcoming delay in a critical shipment due to an approaching storm. The company can then proactively source those components from another supplier, preventing a disruption in production.
Types of Machine Learning and Their Uses
Different types of machine learning algorithms are best suited for specific analytical tasks. Supervised learning, which uses labeled data, excels at predictive modeling. Unsupervised learning, using unlabeled data, is effective for identifying patterns and grouping similar data points, enabling customer segmentation and anomaly detection. Reinforcement learning, where algorithms learn through trial and error, is valuable for dynamic optimization, such as personalized recommendations and pricing strategies.
The Power of Collaboration: Humans and AI
While AI offers powerful analytical capabilities, human expertise remains essential. The most effective applications of AI in data analysis combine the strengths of both. Analysts can leverage AI-generated insights to identify areas that warrant further investigation. They can then apply their domain expertise to interpret those findings and formulate strategies. This collaborative approach ensures that AI augments human capabilities, leading to more impactful business decisions. This synergy between humans and AI is the key to unlocking the full potential of data – empowering businesses to achieve levels of analytical sophistication never before possible.
Mastering Real-Time Analytics for Competitive Advantage
Turning data into actionable insights is essential for success in today’s competitive business world. But simply possessing data isn’t enough. To truly stand out, organizations need to master real-time analytics, transforming live data streams into immediate, usable knowledge. This involves understanding which business processes genuinely benefit from real-time insights and which are better served by traditional batch processing. It also requires careful planning of infrastructure and organizational adaptations.
Real-Time vs. Batch Processing: Choosing the Right Approach
While real-time insights offer significant advantages, it’s crucial to recognize that not every process requires instant data. Analyzing long-term sales trends for yearly marketing strategies, for example, is a perfect task for batch processing. However, situations like fraud detection, personalized e-commerce recommendations, and monitoring critical infrastructure performance often demand the speed of real-time analysis. Choosing the appropriate method is essential for maximizing efficiency and return on investment. Implementing real-time analytics unnecessarily can create undue complexity and expense. Conversely, relying on batch processing when real-time insights are crucial can lead to missed opportunities and costly delays.
Building a Real-Time Analytics Infrastructure
Effective real-time analytics requires a strong and adaptable infrastructure. This typically involves technologies like stream processing platforms (e.g., Apache Kafka, Apache Flink) and in-memory databases (e.g., Redis, Memcached) to handle the constant flow of information. Businesses must also consider the necessary technical expertise to build and maintain these systems. This could mean upskilling existing staff or recruiting engineers specializing in real-time data processing. Building the right infrastructure is the foundation for transforming data into immediate, actionable insights.
Organizational Changes: Embracing a Data-Driven Culture
Technology alone is not enough. Mastering real-time analytics necessitates a cultural shift within the organization. This involves cultivating a data-driven mindset across departments and empowering employees to base decisions on real-time information. This often means implementing new procedures for data access and analysis, along with training to help employees interpret and utilize real-time data effectively. It also requires dismantling data silos and ensuring all relevant teams can access the necessary information. Customer service representatives, for instance, could use real-time data on customer behavior to personalize interactions and improve satisfaction. Marketing teams can similarly leverage real-time analytics to optimize campaigns based on current audience engagement.
Real-World Examples: Turning Insights into Action
Many companies are already benefiting from real-time analytics. Ride-sharing services use real-time data on traffic and driver availability to optimize routes and minimize wait times, enhancing customer experience and improving operational efficiency. E-commerce platforms use real-time analytics to personalize product recommendations based on browsing history and purchases, leading to increased sales and customer loyalty. The global data analytics market is expected to reach $482.61 billion by 2033, expanding at a CAGR of 23.12% from 2025 to 2033. This growth underscores the rising need for tools to process and analyze vast datasets from digital platforms. You can find more detailed statistics here.
Monitoring and Alerting: Ensuring Reliable Insights
Real-time analytics systems demand constant monitoring and robust alerting. These systems need to be designed to quickly detect and resolve potential problems, ensuring a continuous flow of dependable insights. This means implementing alerts for data quality issues, system performance problems, and any unusual activity that could impact the analysis accuracy. Effective monitoring and alerting are fundamental to maintaining the integrity and reliability of real-time systems. This ensures businesses can trust the data and make informed decisions with confidence. This reliability empowers organizations to act decisively and capitalize on opportunities as they emerge. By concentrating on the appropriate business processes, building the right infrastructure, fostering a data-driven culture, and implementing thorough monitoring, organizations can successfully harness the power of real-time analytics for a true competitive edge.
Choosing Tools That Actually Deliver Results

Turning data into actionable insights requires the right tools. With so many analytics tools available, choosing the best ones can feel overwhelming. This section offers practical guidance, cutting through the hype to provide realistic comparisons based on real-world use.
Evaluating Tools Based On Your Needs
Selecting the right tools begins with understanding your specific business requirements. Don’t be distracted by long feature lists. Instead, concentrate on how a tool aligns with your objectives. For instance, if you aim to improve customer retention, look for tools specializing in customer behavior analysis and predictive modeling. Consider factors like data integration capabilities, ease of use, and scalability when making your decision. This focused approach helps ensure you choose tools that directly contribute to your business goals.
Key Considerations For Tool Selection
Several critical aspects should guide your analytics tool selection process:
- Data Integration: Can the tool seamlessly integrate with your current data sources?- Analytical Capabilities: Does it provide the analytical functions you require, such as predictive modeling or real-time analysis?- Visualization and Reporting: How effectively does the tool present data in a clear, actionable format?- Cost and Maintenance: What are the overall costs, including implementation, training, and ongoing maintenance?- User Friendliness: How easy is it for your team to learn and use the tool effectively?
Considering these factors helps ensure the chosen tools provide the necessary insights and integrate smoothly into your existing workflow.
Understanding Integration Challenges
Integrating new analytics tools can be challenging. Data often resides in different systems, requiring careful planning to ensure smooth data flow. Compatibility problems between different software solutions may also arise, necessitating custom integrations or workarounds. Addressing these challenges proactively streamlines the process and avoids costly delays.
Emerging Technologies In The Analytics Landscape
The field of data analytics is always changing. Cloud-based analytics platforms and AI-powered tools offer new ways to transform data into actionable insights. These technologies can automate complex analyses, identify patterns, and generate more accurate predictive insights. Staying informed about these advancements helps you select tools that meet both current and future needs.
Building A Cohesive Analytics Toolkit
Instead of relying on a single tool, building a cohesive toolkit is often beneficial. Different tools may excel at different analyses, creating a more versatile analytical environment. However, ensure the tools integrate well to avoid data silos.
To help you compare different tools, we’ve compiled the following table:
Data Analytics Tools Comparison MatrixComprehensive comparison of leading data analytics tools and platforms ToolPrimary Use CaseLearning CurveCost RangeIntegration CapabilitiesBest ForGoogle AnalyticsWebsite Analytics & ReportingModerateFree - $$$ (depending on usage & features)ExtensiveBusinesses of all sizesTableauData Visualization & Business IntelligenceModerate$$ - $$$$ (depending on license type and users)ExtensiveMedium to Large EnterprisesPython with Pandas/Scikit-learnData Science, Machine Learning, & Predictive ModelingHighFree (Open Source)Highly Customizable through LibrariesData Scientists & AnalystsSplunkReal-Time Log Management & Security AnalysisModerate to High$$ - $$$$ (depending on data volume & features)ExtensiveIT Operations, Security Teams, and Large Enterprises This table provides a general comparison. It’s essential to perform your own research, carefully evaluating each tool’s capabilities against your organization’s specific requirements. This ensures you select the tools that will genuinely turn data into actionable insights, driving business success. Investing in adequate training is also critical, empowering your team to fully utilize the tools and extract maximum value from the insights.
Communicating Insights That Drive Action
Even the most groundbreaking data insights are meaningless if they don’t result in action. This section explores how to transform complex findings into compelling narratives that inspire decision-makers. We’ll examine how to tailor communication for different audiences, from executives requiring high-level overviews to operational teams needing specific instructions. This involves understanding the nuances of data presentation and crafting narratives that connect with audience needs and priorities.
Tailoring Communication to Your Audience
Effective communication begins with understanding your audience. Executives, for instance, typically focus on the big picture and how insights relate to strategic goals. They want the “so what?” – the implications for the business. Present them with concise summaries and clear recommendations. Operational teams, conversely, need specific guidance. They want the “how” – the concrete steps to take based on the data. Provide them with detailed instructions, action plans, and practical tools. Understanding these distinct needs is vital for turning insights into action.
Crafting Compelling Visualizations
Visualizations are powerful tools for conveying complex information quickly. However, poorly designed visualizations can create confusion. Focus on simplicity and clarity. Choose charts and graphs that directly support your key messages, avoiding unnecessary clutter. A line graph is excellent for showing trends over time, while a bar chart effectively compares different categories. Interactive Tableau dashboards can allow audiences to explore the data firsthand, leading to deeper understanding and engagement. The goal is to illuminate the insights, making them easy to grasp.
Building Narratives That Connect Data to Business Outcomes
Data alone rarely inspires action. To drive change, create a narrative that connects insights to tangible business outcomes. Explain not just what the data shows, but why it matters and how it can improve the business. For example, instead of reporting a decline in customer satisfaction, explain its potential impact on revenue and customer churn. Then, propose concrete, data-backed steps to address the underlying issues. Framing insights within a compelling story makes them more relevant and persuasive.
Handling Questions and Objections Effectively
Be prepared to answer questions and address objections. Anticipate potential pushback and develop clear, data-backed responses. This builds confidence in your recommendations. Create an environment for open discussion and consider alternative perspectives. This fosters collaboration and builds consensus around proposed actions. Turning data into action is a two-way street, requiring audience engagement and constructively addressing their concerns.
Ensuring Your Insights Lead to Concrete Actions
The ultimate goal is to translate insights into tangible results. Establish clear next steps and assign responsibilities. This creates accountability and ensures recommendations aren’t forgotten. Track progress regularly and measure the impact of implemented actions. This demonstrates the value of data-driven decision-making and encourages continuous improvement. Turning insights into concrete actions creates a virtuous cycle where data continuously informs and improves business performance. This feedback loop refines strategies and optimizes outcomes. Platforms like Statisfy can be helpful in this process, automating data collection and analysis, and providing actionable recommendations for customer success teams. You can learn more about how Statisfy helps turn data into actionable insights here.
Key Takeaways
Your journey to turning data into actionable insights involves several key steps, each contributing to a more informed and effective decision-making process. These takeaways provide a practical roadmap, highlighting the crucial elements for transforming raw data into valuable business intelligence.
Define Clear Objectives
Before diving into data analysis, clearly define your goals. What specific questions are you trying to answer? Which business outcomes are you aiming to improve? Focusing on these questions ensures your analysis remains relevant and purposeful. For example, if increasing sales is your goal, your analysis should focus on identifying factors that influence purchasing behavior.
Identify Relevant KPIs
Selecting the right Key Performance Indicators (KPIs) is crucial for measuring progress towards your objectives. If your goal is customer retention, relevant KPIs might include churn rate and customer lifetime value. These metrics provide quantifiable measures of your success.
Ensure Data Quality
Data quality is paramount. Implement practical data quality checks to address potential errors and inconsistencies. This ensures the reliability of your analysis and the validity of your insights. Just as a house built on a shaky foundation is unstable, flawed data leads to unreliable conclusions.
Choose the Right Tools
Select analytics tools that align with your specific needs and technical expertise. Consider factors like data integration capabilities, ease of use, and cost. A powerful tool like Statisfy can automate many aspects of data analysis, freeing up your time for strategic decision-making.
Leverage AI and Machine Learning
AI and Machine Learning (ML) can enhance your ability to uncover hidden patterns and make more accurate predictions. Tools like Statisfy integrate AI to provide deeper insights into customer behavior and generate personalized recommendations. Remember, however, that human expertise remains essential for interpreting these insights and formulating effective strategies.
Communicate Effectively
Even the most insightful data is useless if not communicated effectively. Tailor your communication to your audience, using clear visualizations and compelling narratives to connect data insights to business outcomes. For executives, focus on the “so what?” – the implications for the business. For operational teams, provide the “how” – the concrete steps to take.
Embrace Real-Time Analytics (When Necessary)
Real-time analytics offers immediate insights into critical business processes. However, it’s important to assess whether real-time analysis is truly necessary, or if batch processing is sufficient. Implement real-time analytics strategically to gain a competitive advantage where immediate action is required.
Foster a Culture of Continuous Improvement
Turning data into actionable insights is an ongoing process. Continuously monitor your results, refine your strategies based on feedback, and stay updated on emerging trends in data analysis. This iterative approach ensures your analytics efforts deliver sustained value as your organization evolves. Building a culture of data-driven decision-making empowers teams to act proactively and adapt to changing market conditions. This cycle of continuous improvement is key to long-term success.
Implementing these key takeaways will empower you to transform raw data into valuable business intelligence, enabling you to make informed decisions that drive real results. Platforms like Statisfy can streamline this process, providing automated data analysis and actionable recommendations for customer success teams. Learn more about how Statisfy can help you turn data into actionable insights at https://www.statisfy.com.