Build a Customer Health Score That Predicts Churn
By Navin Agrawal · Co-Founder & CTO, Statisfy
Most CS teams have a health score. Most health scores do not work.
The tell is in the retrospective: when you look at accounts that churned in the last 12 months, what was their health score 90 days before they left? If the answer is mostly green or yellow — if your health score was not red before they churned — then the model is not predictive. It is descriptive at best, and a false confidence signal at worst.
Customer health score definition: A customer health score is a composite numeric signal (typically 0–100) that aggregates multiple behavioral and relationship indicators into a single number representing the likelihood that an account will renew and expand. A predictive health score changes meaningfully in response to leading indicators before a customer actively communicates dissatisfaction.
This guide covers why most health scores fail, the five signals that actually predict churn, a weighting framework you can implement immediately, and how to validate your model before you rely on it. If you want the account-level view of these signals in practice, see how to identify customers at risk of churning before they cancel.
Why Most Health Scores Fail
The most common failure mode is not too few signals — it is too many signals weighted equally.
CS platforms encourage teams to build health scores with 10–15 inputs: product usage, NPS, support tickets, stakeholder count, contract value, renewal date proximity, engagement score, QBR completion, training hours, integration depth, and more. When every metric has equal weight, the score becomes a lagging average. Accounts that are slightly below average on every metric look amber. Accounts with one severe signal buried in a sea of green metrics look healthier than they are.
The second failure mode is not backtesting. Most health scores are built prospectively — the team decides what signals should matter and assigns weights based on intuition. They are never validated against actual churn history. The result is a model that feels logical but has no empirical grounding.
“In a study of 200 SaaS CS organizations, health scores predicted churn with meaningful accuracy in fewer than 35% of teams. The primary differentiator of high-accuracy teams was backtesting against 12+ months of churn data before deploying the model.”
The third failure mode is using output metrics as inputs. If you include NPS score in your health score, you are using a customer-reported satisfaction signal. NPS is a lagging indicator — customers report dissatisfaction after they have already decided not to renew, not before. Behavioral signals (what customers actually do in the product) are leading. Sentiment signals (what customers say they think) are lagging.
The 5 Signals That Actually Predict Churn
These five signals consistently show up as leading predictors across B2B SaaS companies. They are ordered by typical predictive weight, though your weights will vary based on backtesting.
Signal 1: Product Usage Frequency (30-day active sessions)
How often is the product being used? Not total sessions, but distinct active days in the past 30 days. An account with 15 distinct active days in the past month looks very different from one with 3, regardless of whether session depth looks similar.
Why it predicts churn: Usage frequency is the single most reliable behavioral signal for renewal intent. Customers who have stopped logging in regularly have mentally deprioritized the product, even if they have not started the cancellation process. The decline often starts 60–90 days before renewal.
Threshold to watch: A 40% or greater decline in 30-day active sessions compared to the same account’s 90-day baseline.
Signal 2: Feature Adoption Breadth
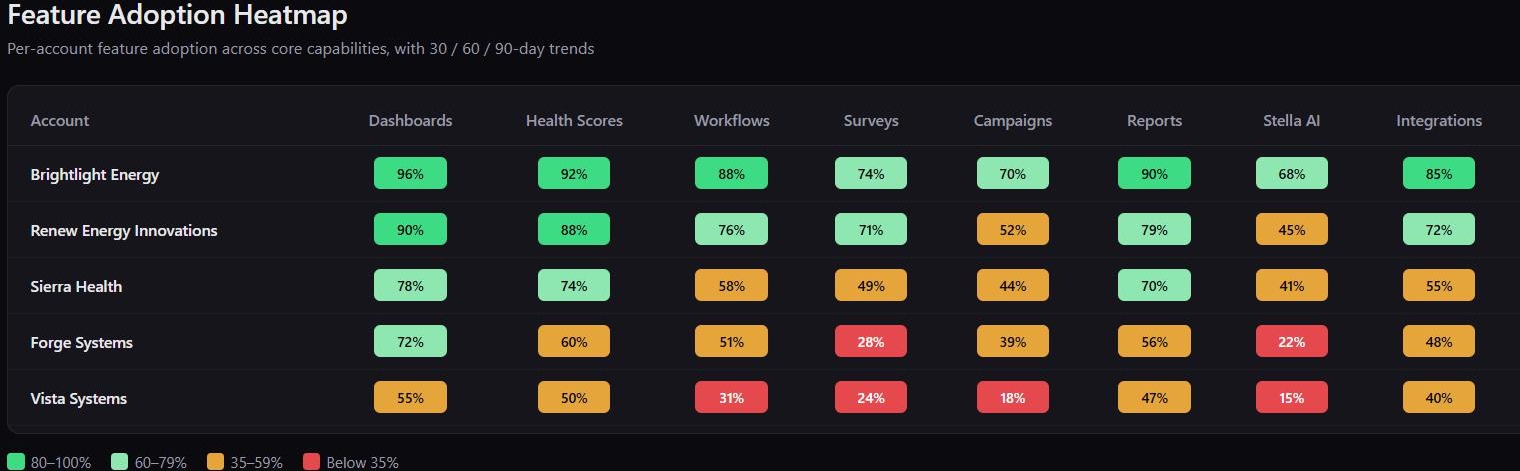
How many of the core features is the customer actively using? Not features they have access to — features they have actually used in the past 60 days. Define your 5–7 core features (the capabilities that deliver your primary value proposition) and track the count of adopted features per account.
Why it predicts churn: Accounts using only 1–2 core features have not internalized your product’s value. When budget pressure arrives, the product is easy to cut. Accounts using 4–5 core features have deeper hooks and a more defensible ROI story.
Threshold to watch: Accounts below 40% core feature adoption are structurally at risk.
Signal 3: Stakeholder Engagement Depth
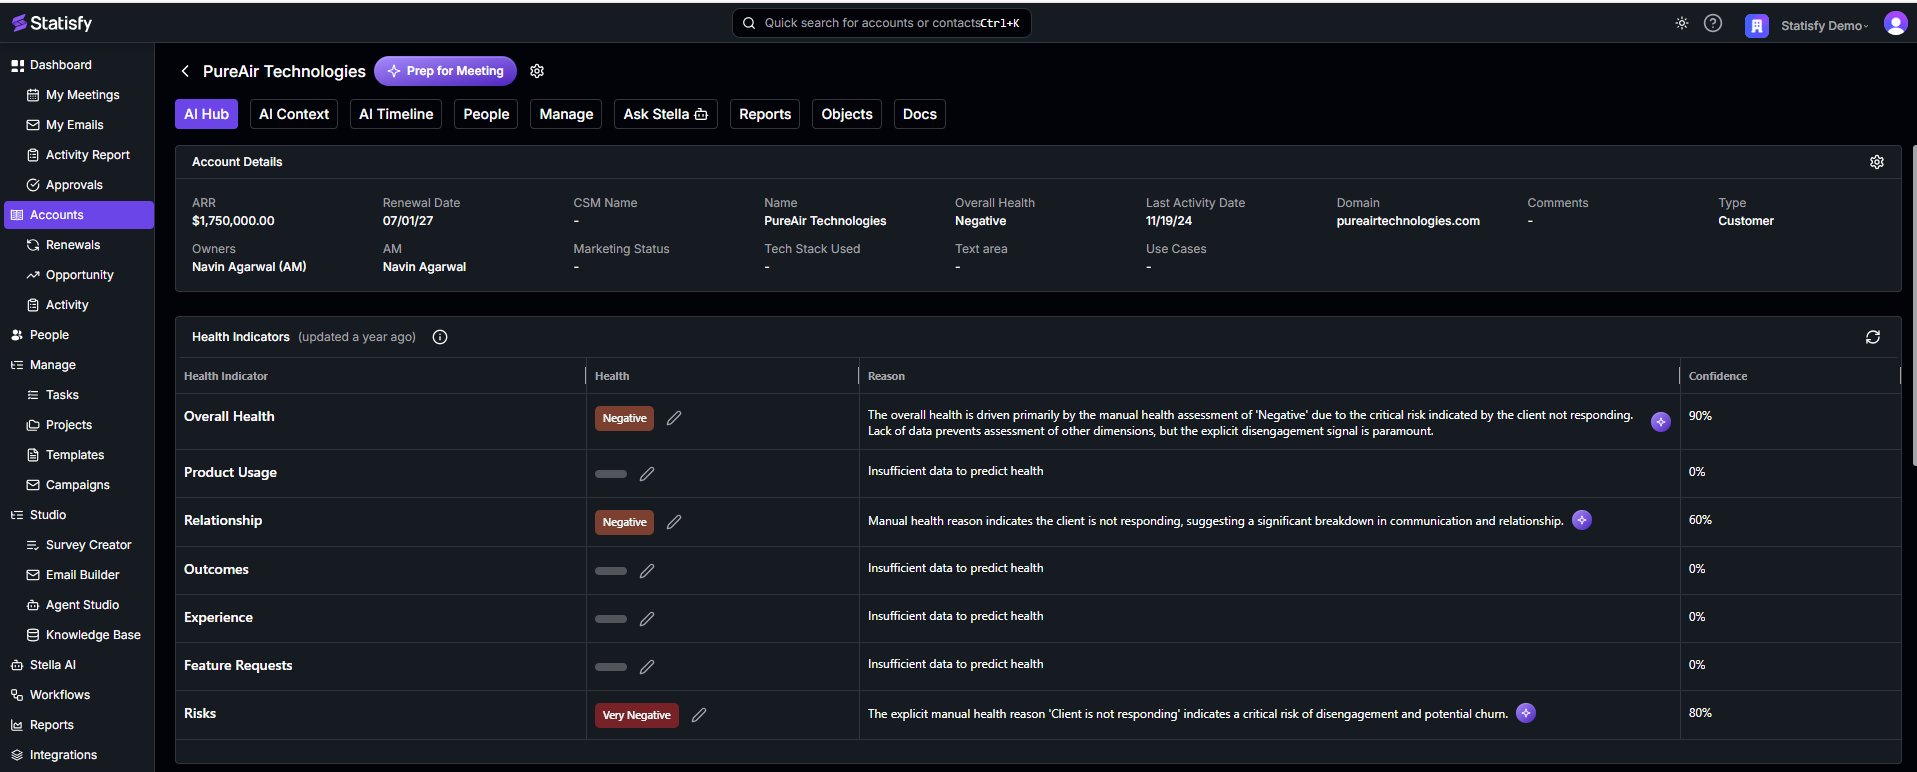
How many distinct users are actively engaging with the product? More critically: is the primary champion active? An account with 20 licenses but only 2 active users in the past 30 days is one champion departure away from complete disengagement. Multi-threading — having relationships with multiple stakeholders across levels — is one of the strongest protective factors against churn.
Why it predicts churn: Champion turnover is the leading cause of churn in B2B SaaS that is not driven by product failure. When the person who bought the product and championed it internally leaves, the account becomes vulnerable unless there are other internal advocates.
Threshold to watch: Single-threaded accounts (only 1–2 active users, all in the same role) with a renewal inside 6 months.
Signal 4: Support Health Trajectory
Not just ticket count — the trend. An account with 2 open tickets that always has 2 open tickets is different from an account that went from 0 tickets to 5 tickets in 30 days. Track 30-day ticket volume vs the prior 90-day baseline, and severity weight: an escalated or unresolved ticket older than 14 days is a red flag.
Why it predicts churn: High support friction signals that the customer is investing significant effort just to get the product to work. This erodes the perceived ROI and increases the emotional cost of staying, even if the product is technically functional.
Threshold to watch: 2x or greater ticket volume vs baseline, or any open ticket older than 21 days with severity medium or above.
Signal 5: Commercial Signals
Renewal proximity and payment behavior. An account whose renewal is 90 days out gets automatically weighted differently than an account at 270 days. Similarly, a late payment, a billing dispute, or a request to downgrade pricing before renewal are early commercial signals that often appear before a formal non-renewal notice.
Why it predicts churn: These signals are often dismissed as admin issues, but they are behavioral. A company that is about to renew enthusiastically does not question invoices.
Threshold to watch: Renewal inside 90 days combined with any other amber or red signal. Payment later than 30 days on the most recent invoice.
The Weighting Framework
| Signal | Recommended Weight | Green Threshold | Red Threshold |
|---|---|---|---|
| Usage Frequency (30-day sessions) | 30 points | ≥ 90% of baseline | ≤ 50% of baseline |
| Feature Adoption Breadth | 25 points | ≥ 60% of core features | ≤ 30% of core features |
| Stakeholder Engagement | 20 points | 3+ active users, multi-role | Single user active, champion at risk |
| Support Health Trajectory | 15 points | Baseline or below, no open >14d | 2x+ baseline or escalated open ticket |
| Commercial Signals | 10 points | Renewal > 90d, payment current | Renewal < 90d + any red signal |
Score each signal 0–100 within its category, then multiply by weight and sum. A composite score above 70 is green. 50–70 is amber. Below 50 is red and should trigger immediate action regardless of renewal date.
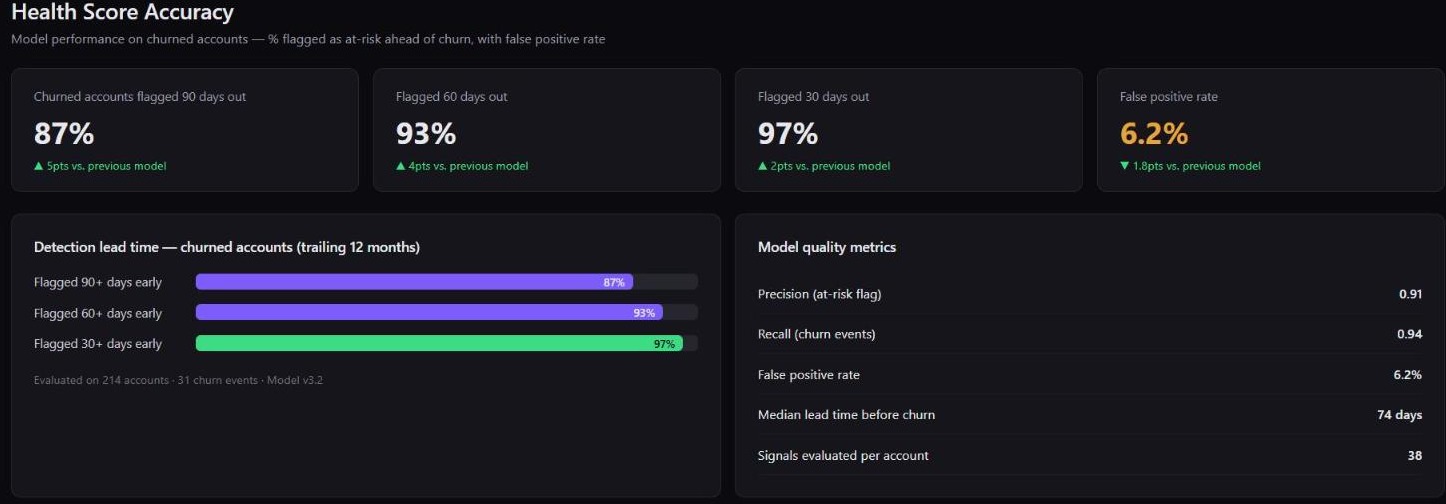
Important note on weights: These weights are starting points, not universal truths. The only way to know the right weights for your business is to backtest against your actual churn history. Run the model on accounts that churned in the past 12 months and see what their score looked like 90 days before churn. Adjust weights until the model would have flagged at least 70% of those accounts as amber or red before the event.
Skip the manual weighting and backtesting
Start a free trial and Statisfy will build a first-pass health score from your existing CRM, product, and support data — then show you how it would have scored your churned accounts historically.
How to Backtest Your Health Score
Backtesting is the most skipped step in health score design. It is also the most important.
Step 1: Pull a list of every account that churned or contracted significantly in the past 12–18 months.
Step 2: For each churned account, reconstruct what their health score would have been 30, 60, and 90 days before the churn event, using historical behavioral data.
Step 3: Calculate the percentage of churned accounts your model would have flagged as amber or red at each time horizon. A good model catches 65%+ of churn at 90 days and 80%+ at 30 days.
Step 4: Identify the patterns in the misses. Were there signals you did not include? Were certain segments systematically missed (enterprise vs SMB behave differently)? Adjust weights and add signals accordingly.
Step 5: Calculate your false positive rate. If your model flags 50% of your accounts as at-risk at any given time, the signal is too noisy to be actionable. Aim for a red-flag rate below 20% of your account base.
What to Trigger at Each Score Threshold
A health score is only valuable if it triggers action. Define your playbooks before you deploy the model.
Green — Monitor and expand
No intervention needed. Flag for expansion signal review monthly. If seat utilization is above 75%, add to expansion pipeline.
Amber — Proactive value check-in
CSM schedules a 20-minute health check call within 2 weeks. Objective: identify the friction point. Not a QBR — a focused conversation about one specific thing that changed.
Red — Escalated intervention
CSM + AE joint outreach within 5 business days. Executive sponsor notified. Custom save plan created with 30-day action items for both sides. Renewal timeline reviewed.
Critical — Executive escalation
VP of CS flagged immediately. Executive-to-executive outreach initiated. This account is at high risk of churn in the next 90 days without direct executive involvement.
The Maintenance Problem
Health scores decay. Your product changes, your customer segments evolve, and your playbooks improve — all of which change the predictive value of the underlying signals. A health score built in Q1 2025 may be materially less accurate by Q1 2026 if it has not been recalibrated.
Plan for a quarterly review of your model accuracy. Pull the same backtesting analysis every 90 days and check whether the accuracy rate is holding. If it drops below 60% at the 90-day mark, the model needs recalibration.
“Teams that recalibrate their health scores quarterly maintain accuracy 2.3x longer than teams that deploy and leave the model static. The half-life of an uncalibrated health score in a product that ships features quarterly is roughly 9 months.”
The alternative to manual recalibration is an AI-powered health score that updates its own weights automatically as new behavioral data accumulates — adjusting for your specific customer base rather than running on static rules you configured once. A health score that actually holds up shows up directly in the number that matters to the board — see what separates 130% NRR from 105% NRR.
Statisfy auto-builds and continuously recalibrates health scores from your CRM, product analytics, and support data. No rules to configure, no weights to set manually — the model trains on your churn history and updates as your product and customer base evolve.
Want to see this run against your own churn history?
Start a free trial and Statisfy will show you how the model scores your accounts today — no need to wait for a walkthrough.
Compare
How Statisfy compares.
Side-by-side, parameter-by-parameter comparisons with the CS platforms teams evaluate us against.
- Statisfy vs Gainsight Rule-based CTAs vs work already drafted.
- Statisfy vs ChurnZero Plays and ChurnScores vs zero-config action.
- Statisfy vs Vitally Playbook-and-Copilot vs work that's already done.
- Statisfy vs Totango + Catalyst Three products you stitch together vs one platform that acts.
- Statisfy vs Planhat Configurable system of record vs AI-native system of action.
- Statisfy vs Hook ML alerts vs the full loop from signal to autonomous action.
- Statisfy vs Staircase AI Gainsight's communication intelligence add-on vs standalone AI-native platform.