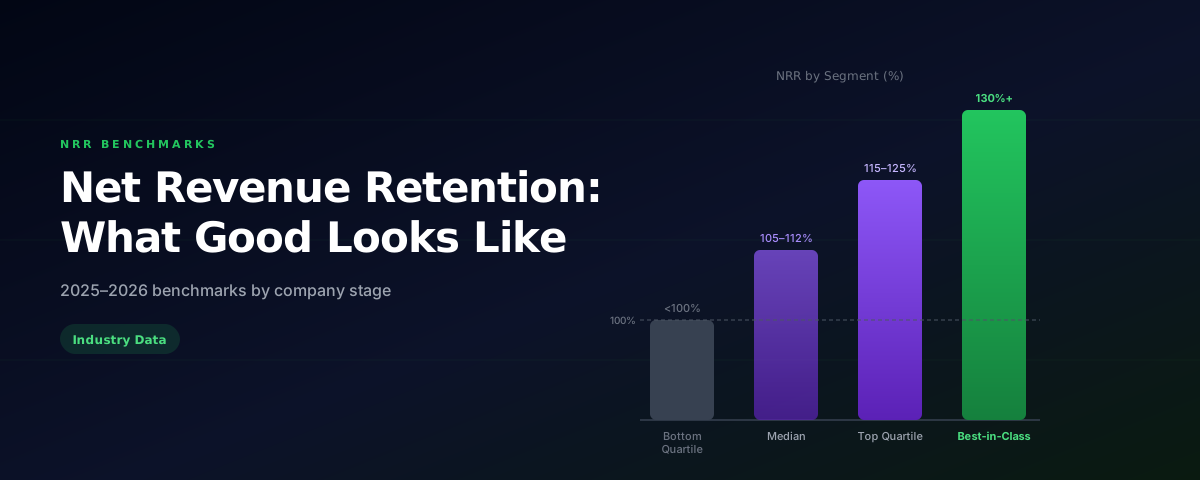
Net Revenue Retention Benchmarks for 2025–2026
By Navin Agrawal · Co-Founder & CTO, Statisfy
Net revenue retention is the single metric that most accurately predicts whether a SaaS business will compound or stagnate. A company with 120% NRR doubles its revenue from existing customers every five years without adding a single new logo. A company at 90% NRR is quietly losing ground no matter how fast it acquires new customers.
Net Revenue Retention (NRR) definition: NRR measures the percentage of recurring revenue retained from existing customers over a period, including expansion (upsells, cross-sells, seat additions) and subtracting contraction (downgrades) and churn. Formula: (Starting MRR + Expansion − Contraction − Churn) ÷ Starting MRR × 100.
This guide covers the actual benchmarks — by stage, segment, and model — what drives the gap between top and bottom quartile performers, and the CS levers that move NRR in practice.
NRR Benchmarks by Performance Tier (2025–2026)
| Performance Tier | NRR Range | What It Means | Typical Profile |
|---|---|---|---|
| Best-in-Class | 130%+ | Revenue from existing base doubles ~every 5 years | Snowflake, Datadog, HubSpot — usage-based or deeply embedded platforms |
| Top Quartile | 115–130% | Strong expansion motion, low churn | Enterprise SaaS with mature CS and seat-based expansion |
| Median | 100–115% | Expansion roughly offsets churn and contraction | Mid-market SaaS, 3–7 year old companies |
| Bottom Quartile | 90–100% | Revenue base shrinking; needs new logo growth to cover | SMB-heavy, high churn segments, or commoditized categories |
| Danger Zone | <90% | Structural revenue leak; new logos cannot keep up | Product-market fit issues or severe competitive displacement |
“74% of CS leaders report that the majority of company revenue comes from existing customers. Yet fewer than 40% of CS orgs have a formal expansion motion with clear signal triggers and a CS-to-AE handoff process.” — ChurnZero 2025 State of CS Report
NRR Benchmarks by ARR Segment
NRR benchmarks vary significantly by who you sell to. A company selling to Fortune 500 accounts with five-figure ACV will have very different dynamics than a company selling to SMBs at $5,000 ACV.
| Customer Segment | Typical NRR Range | Expansion Driver | Primary Churn Risk |
|---|---|---|---|
| Enterprise (>$100k ACV) | 110–135% | Seat expansion, new departments | Champion turnover, M&A |
| Mid-Market ($20–100k ACV) | 100–120% | Upsell tiers, integrations, seats | Budget cuts, competitive displacement |
| SMB ($5–20k ACV) | 85–105% | Seat growth, plan upgrades | Price sensitivity, low switching cost |
| Startup (<$5k ACV) | 70–95% | Company growth, plan upgrades | Company failure, budget elimination |
The implication: if you sell to SMBs and are reporting 105% NRR, that is genuinely top-quartile performance for your segment. If you sell to enterprise accounts and are at 105%, you have meaningful headroom to chase.
NRR Benchmarks by Company Stage
Stage matters because the customer base composition, the maturity of the CS function, and the expansion motion are all correlated with company age.
| Company Stage | Healthy NRR | Top Quartile NRR | Common Bottleneck |
|---|---|---|---|
| Seed / Pre-Series A | 85–100% | 100–110% | Small base, few expansion candidates |
| Series A ($3–10M ARR) | 95–110% | 110–120% | CS process not yet formalized |
| Series B ($10–30M ARR) | 100–115% | 115–130% | Scaling CS without proportional headcount |
| Series C+ ($30M+ ARR) | 105–120% | 120–140% | Account segmentation and CS ops sophistication |
| Public SaaS (median) | 107–112% | 120%+ | Enterprise vs SMB mix, macroeconomic headwinds |
What Separates 130% NRR from 105% NRR
The gap between top-quartile and median NRR is not random. It comes down to five structural differences in how the CS function operates.
1. Proactive expansion motion vs reactive renewal defense
Median NRR companies focus CS on preventing churn. Top-quartile NRR companies focus CS on creating expansion opportunities and prevent churn as a baseline, not the goal. The framing shift changes what CSMs spend their time on. They look for accounts hitting usage limits, new stakeholders engaging with the product, and business changes that suggest expanded need — before the customer thinks to ask.
2. Health scoring that includes expansion signals, not just churn signals
Most health scores are built to detect churn risk. They flag declining usage, support tickets, and reduced engagement. Top-quartile NRR teams build health scores that also flag expansion readiness: seat utilization above 75%, feature adoption breadth above a threshold, and champion tenure long enough that a conversation about expansion will land. See how to build a health score that actually predicts churn for the underlying signal weighting.
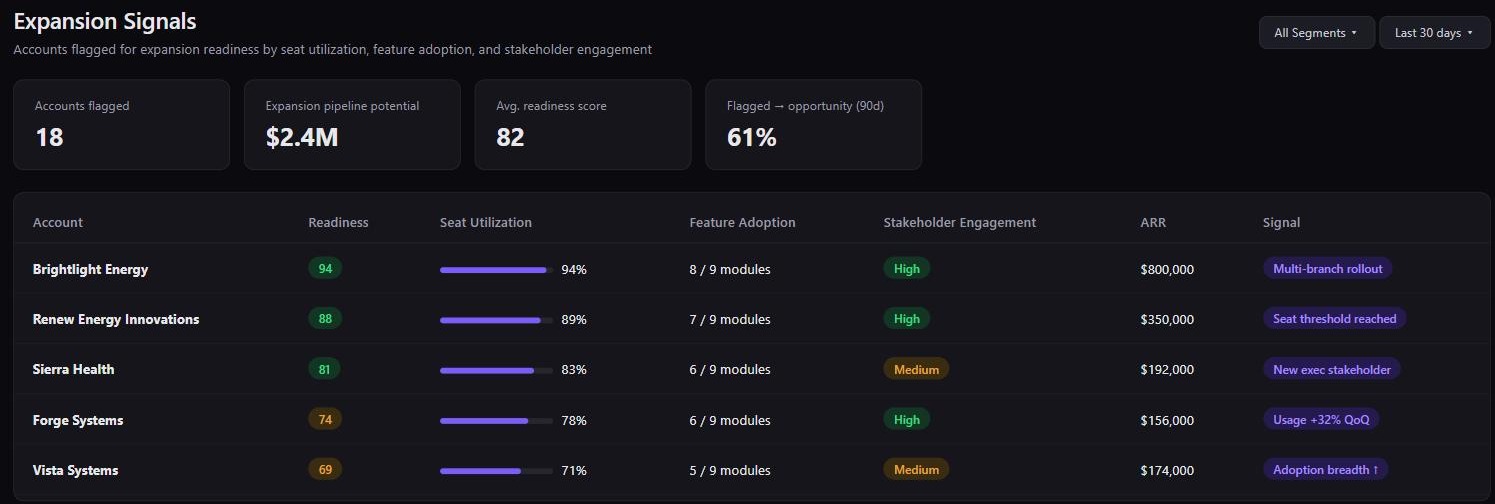
3. CS-to-AE handoff process that is defined, not ad hoc
At 105% NRR companies, expansion opportunities surface by accident: a CSM happens to notice an account growing and mentions it to the AE. At 130% NRR companies, there is a documented handoff process — specific signal thresholds trigger an automatic handoff workflow, the AE receives a pre-built account brief, and the CS team is compensated for sourcing the opportunity. See the full CS-to-sales handoff playbook for how to structure this.
4. Customer-facing ROI reporting at QBRs
Accounts that understand the ROI of your product are far less likely to churn and far more likely to expand. Top-quartile NRR companies have built ROI quantification into the quarterly review process — showing customers exactly what they have gotten, in their own metrics, not generic platform statistics. This is exactly the shift covered in the modern QBR playbook: replacing the slide deck with a live, customer-facing ROI view.
5. AI-powered intervention speed
The time between a churn signal appearing and a CSM taking action is one of the most measurable predictors of renewal outcome. Top-quartile NRR companies have AI systems that detect signals and trigger interventions within 24–48 hours. Median companies rely on weekly review meetings, which means accounts can show distress for 7–10 days before anyone acts.
“Reducing average time-to-intervention from 9 days to 2 days was correlated with a 6 percentage point improvement in gross retention rate over the subsequent two renewal cycles.” — Statisfy customer data, 2025
Find out where your NRR gap actually is
Start a free trial and Statisfy will break down your last 12 months of churn and contraction against these five levers — no spreadsheet reconciliation required.
How to Diagnose Your NRR Gap
If your NRR is below benchmark for your segment, the diagnosis almost always falls into one of three categories.
Churn-driven decline: Your gross retention is below 85–88%. This means accounts are leaving in large enough numbers that expansion cannot compensate. The fix is a predictive health score and faster intervention cadence before renewal.
Contraction-driven decline: Customers are renewing but downgrading — taking fewer seats, moving to a lower tier, or removing modules. This signals value delivery failure: the customer no longer believes the full product is worth the price. The fix is ROI documentation and mid-year value conversations, not just annual QBRs.
Expansion-opportunity miss: Gross retention is healthy (90%+) but NRR is flat around 100–105%. This means you are retaining customers but not growing them. The fix is the expansion motion — signals, triggers, and CS incentive alignment.
Diagnostic question: Pull your last 12 months of churned and contracted accounts. What percentage showed quantifiable warning signs (usage decline, reduced logins, support spike) more than 60 days before the event? If the answer is above 60%, your problem is detection lag and intervention speed. If the answer is below 40%, your problem is health signal quality — the model is not catching the right signals early enough.
The Five Levers That Move NRR
In order of typical impact magnitude and implementation speed:
- Intervention speed on at-risk accounts — Fastest ROI, solvable with the right alerting without a full platform change
- Expansion signal identification — Requires health score that goes beyond churn detection
- CS-to-AE handoff formalization — Process change, not technology; can be implemented in weeks
- ROI documentation at QBRs — Requires connecting your CS platform to customer outcome data
- Pricing architecture for natural expansion — Slowest to change, highest ceiling for NRR upside
Most CS organizations should focus on levers 1–3 before touching lever 5. Pricing architecture changes require product and finance involvement, and they take quarters to produce measurable results. Levers 1–3 can move your NRR within a single renewal cycle.
Statisfy auto-builds health scores that flag both churn risk and expansion readiness. Teams typically move from detection lag of 7–10 days to under 48 hours within the first month. Most see measurable NRR improvement by the second renewal cycle.
See where you'd land on this benchmark
Start a free trial and Statisfy will map your current churn and expansion data against these five levers — no benchmark spreadsheet required.
Compare
How Statisfy compares.
Side-by-side, parameter-by-parameter comparisons with the CS platforms teams evaluate us against.
- Statisfy vs Gainsight Rule-based CTAs vs work already drafted.
- Statisfy vs ChurnZero Plays and ChurnScores vs zero-config action.
- Statisfy vs Vitally Playbook-and-Copilot vs work that's already done.
- Statisfy vs Totango + Catalyst Three products you stitch together vs one platform that acts.
- Statisfy vs Planhat Configurable system of record vs AI-native system of action.
- Statisfy vs Hook ML alerts vs the full loop from signal to autonomous action.
- Statisfy vs Staircase AI Gainsight's communication intelligence add-on vs standalone AI-native platform.