The Modern QBR Playbook: Slide Decks vs Live Data
By Divya Singh · Customer Success Manager, Statisfy
The quarterly business review was designed for a world where customer data lived in spreadsheets and getting it in front of a customer required a prepared presentation. That world no longer exists. Every metric your customer cares about is available in real time. And yet, most CS teams are still spending 4–8 hours per account building slide decks that customers skim for five minutes before the call.
“The average CS team spends 3–5 hours per account preparing QBR slide decks. Customers rate QBR value at 5.8 out of 10 on average. The correlation between preparation time and perceived value is essentially zero.” — Gainsight 2024 CS Benchmark Survey
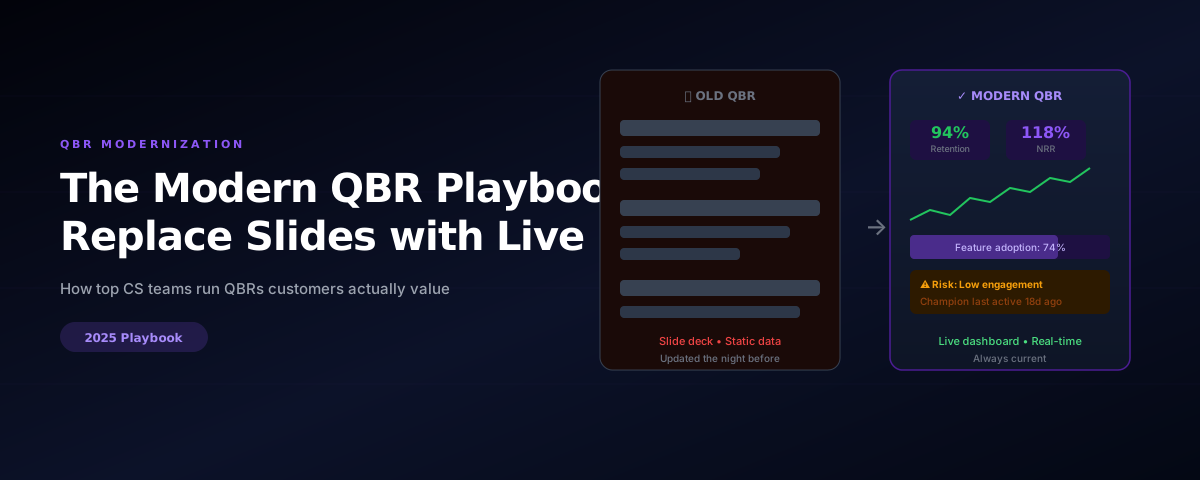
The modern QBR is not a redesigned slide deck. It is a different format entirely: a structured 45-minute conversation anchored in a live dashboard that both parties can see, rather than a presentation one party delivers to the other.
Why the Slide-Deck QBR Is Failing
The slide-deck QBR fails for four structural reasons that have nothing to do with slide quality.
It is always stale. By the time you update the deck and send it, the numbers are 2–5 days old. Customers notice. When a customer points at a metric and says “that does not match what I see in the dashboard,” you have lost the room before the meeting started.
It feels like a vendor pitch. A slide deck is a format associated with selling, not problem-solving. When you walk into a QBR with a beautifully designed 25-slide deck, the customer’s defensive posture goes up. They are waiting for the upsell slide.
It centers your story, not their problem. The structure of a typical QBR slide deck is: features we shipped, your usage statistics, roadmap preview, and renewal. This is what the vendor wants to talk about, not necessarily what the customer needs to discuss. The most important conversations in a QBR — the ones that prevent churn — happen when you surface something the customer was not planning to raise and address it before it becomes a cancellation driver.
It creates asymmetric preparation. You spent hours on the deck. The customer spent zero minutes preparing. The conversation is shallow because one party has thought deeply about the data and the other is seeing it for the first time. The live data format fixes this.
What Customers Actually Want from QBRs
Understanding what customers want from QBRs is the starting point for redesigning the format.
The 5-Part Modern QBR Structure
This structure runs 45–60 minutes and requires a shared live dashboard rather than a slide deck. Both parties look at the same live data throughout.
Account Health Pulse — 5 minutes
Open the live dashboard together. Walk through the health score and its components in under 3 minutes — see how to build a health score that actually predicts churn if you’re still designing yours. Flag anything red before they ask. The message: “Here is where we are, here is what changed, and I want to make sure we address X before we go further.” This establishes trust immediately.
Value Delivered Since Last QBR — 15 minutes
Three to five specific, quantified outcomes — in the customer’s metrics, not yours. “Your team ran 47 automated playbooks. Based on your average CSM hourly rate, that is equivalent to X hours of manual work.” Bring the data, let them confirm it, and ask if it maps to what they expected. This is the core of renewal justification.
What Is at Risk — 10 minutes
Bring the honest conversation. “I want to show you two areas we should be doing better, and I want to hear your read on why.” Show declining usage in a specific segment, an underutilized feature, or a stakeholder gap. Then listen. The customer will tell you things in this section that they would not say if you only showed them the positives.
Next 90 Days: Co-Created Plan — 15 minutes
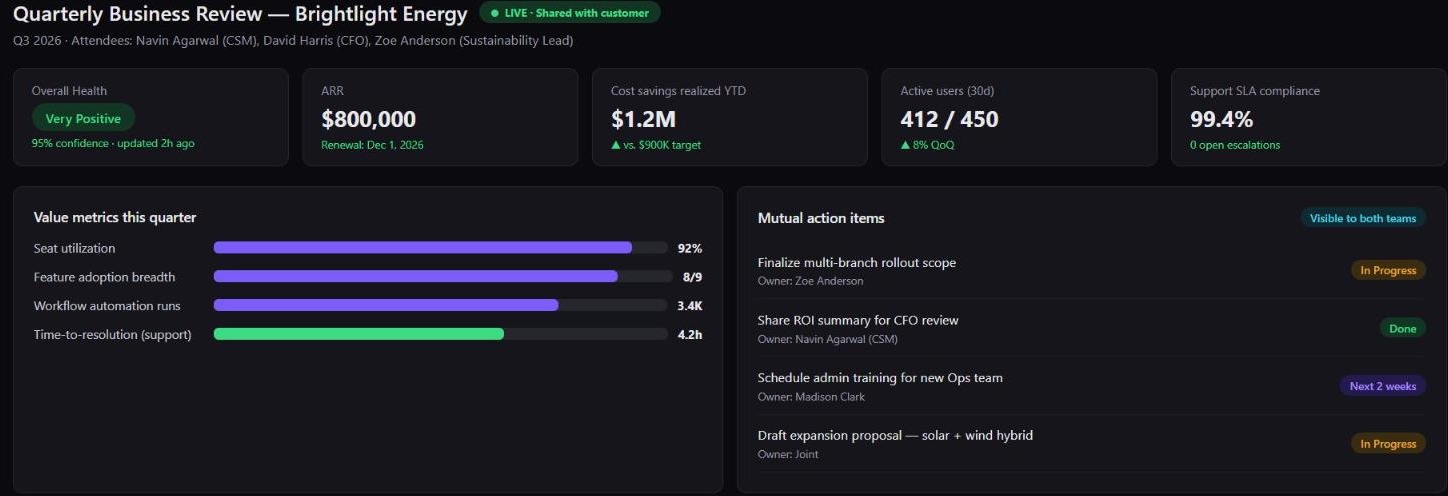
Come with 2–3 suggested actions pre-drafted. Ask the customer to add, modify, or reject them. Document commitments from both sides before the call ends. “We will do X by [date], you will do Y by [date].” Send a written follow-up within 24 hours. A QBR without documented mutual commitments is a conversation, not a business review.
Executive Sponsor Moment — 5 minutes
If an executive sponsor attended (which you should engineer for high-ARR accounts), give them a specific role: validate the forward plan or make one decision that the CSM alone cannot make. Executives who attend QBRs and are given nothing meaningful to do will stop attending. Give them a moment that only they can own.
Run your next QBR off live data instead of a slide deck
Start a free trial and Statisfy will generate a live QBR dashboard from your account health, value, and action-item data — ready before your next customer call.
How to Prepare for a Modern QBR in Under 45 Minutes
The counterintuitive benefit of the live data format is that preparation takes less time, not more. You are not building slides — you are thinking about the story.
Review the health score and its components. What changed in the past 90 days? Is there anything you need to address proactively?
Pull 3–5 ROI data points in the customer’s language. Translate platform metrics into business outcomes. Know these numbers before the call — do not let the customer see you calculate them live.
Prepare one honest problem to surface. If you cannot identify at least one area to improve, either the account is exceptional (unlikely) or you are not looking hard enough (likely). Customers who only hear good news in QBRs stop trusting the messenger.
Draft 2–3 proposed next-quarter actions with owner names. Have a suggestion ready, not a blank sheet.
Check for new stakeholders. Has anyone new started using the product since the last QBR? They may need to be onboarded into the relationship.
The Metrics That Tell You If QBRs Are Working
Most CS teams measure QBR completion rate. That is the wrong metric. Completing a QBR that does not move the renewal needle is not an accomplishment.
Metrics that matter:
QBR-to-renewal conversion rate: Of accounts that had a QBR in the 90-day window before renewal, what percentage renewed vs those that did not have a QBR? The delta is the QBR’s contribution to retention.
Action item completion rate: Of the mutual commitments made in QBRs, what percentage are completed on time by each side? Low completion rate on your side destroys trust. Low rate on the customer’s side signals disengagement.
Executive attendance rate: At high-ARR accounts, is the customer’s economic buyer attending? A QBR without an executive is a middle-management meeting. Its retention value is materially lower.
Net promoter shift after QBR: Do customers who had a QBR show higher NPS scores in the subsequent 30 days? If not, the QBR is not moving perception.
One number to track: Net renewal rate by QBR format. Run the live data format for one quarter across a segment of accounts and compare renewal rates to a comparable segment running the traditional slide format. You do not need statistical significance — a directional signal after one cycle is sufficient to make the format call.
The Transition Plan
Moving from slide-deck to live-data QBRs does not require a big-bang rollout. Start with one account tier.
Pick your mid-market accounts ($20–80k ACV) as the test cohort — large enough to matter, small enough that a failed format experiment does not jeopardize a flagship relationship. Run the live data format for two quarters. Collect feedback from the customer explicitly (“Did this format feel more or less useful than our previous QBRs?”). Adjust and expand.
The resistance will come from your own team, not from customers. CSMs who have spent years perfecting slide decks feel exposed without the structured format. The first few live QBRs will feel uncomfortable. That discomfort is the signal that you are having a more honest conversation than before.
“CS teams that adopted live-data QBRs reported a 23-point increase in customer-rated meeting value within two quarters. They also reported a 40% reduction in QBR preparation time — despite the initial resistance to change.”
Statisfy’s Generate agent builds live QBR dashboards automatically from your account health data, value metrics, and mutual action items. No slides to build — show up to the meeting and open the dashboard. Paired with a health score that actually predicts churn, the QBR becomes a retention tool instead of a status update.
See your first live QBR dashboard this week
Start a free trial and connect your CRM and product data — Statisfy builds the dashboard, you bring the conversation.
Compare
How Statisfy compares.
Side-by-side, parameter-by-parameter comparisons with the CS platforms teams evaluate us against.
- Statisfy vs Gainsight Rule-based CTAs vs work already drafted.
- Statisfy vs ChurnZero Plays and ChurnScores vs zero-config action.
- Statisfy vs Vitally Playbook-and-Copilot vs work that's already done.
- Statisfy vs Totango + Catalyst Three products you stitch together vs one platform that acts.
- Statisfy vs Planhat Configurable system of record vs AI-native system of action.
- Statisfy vs Hook ML alerts vs the full loop from signal to autonomous action.
- Statisfy vs Staircase AI Gainsight's communication intelligence add-on vs standalone AI-native platform.