QBR Report: What It Is, What Goes In It, and 3 Real Examples
By Navin Agrawal · Co-Founder & Head of AI, Statisfy
A QBR slide deck report is a structured document — usually a slide deck or shared doc — that shows a customer what happened over the last quarter, proves the value they got, surfaces risks, and sets the direction for the next few quarters. A good one takes 45 minutes to run. A bad one gets canceled. Most fall into the second category because they recap activity instead of showing outcomes — see the modern QBR playbook for what replacing that static recap with live data actually looks like.
Fun fact: Our customers report that generating a high-quality slide deck for an effective QBR takes them 4–6 hours of pulling content from product metrics and relevant context from support cases, feature requests, meeting transcripts, and customer emails — you get the gist, it’s painful admin work to put together the information needed for a quality QBR discussion. That’s the problem Statisfy solves with the QBR Agent (Customer Context = QBR Deck in 30 seconds). But that is a different conversation. Let’s talk about the QBR meeting for now.
What Is a QBR Report?
A QBR report (Quarterly Business Review report) is a formal review a Customer Success Manager runs with a customer every 90 days. It answers four questions:
- Did you get value last quarter?
- Where are you underusing the product?
- What risks do we need to address?
- What’s the plan for next quarter?
That’s it. The report is the supporting evidence for that conversation.
A QBR is not a “here’s what we did” meeting — it’s a “here’s what you achieved and here’s what we’re doing about the gaps” meeting. The distinction changes everything about what you put in the deck. The structure matters more than the format.
What Goes Into a QBR Report?
A strong QBR covers five areas. Skip any one and the conversation becomes lopsided.

1. Health Score and Account Status
Open with where the account stands — green, yellow, or red — and show the 90-day trend, not just the current number. A score that moved from 62 to 74 tells a better story than a static 74. Don’t hide a yellow score. Customers respect CSMs who name problems early. See how to build a health score that actually predicts churn if your current score isn’t giving you trends worth showing.

2. Adoption and Usage Data
Pull specific metrics, not vanity counts. “14 of your 20 licensed seats are active, with power users running 3+ reports per week” means something. “Your team logged in 847 times” means nothing. Flag unused seats with a plan.
3. ROI and Outcomes
This is the section most CSMs skip or fill with soft claims. Don’t say “we’ve helped you improve efficiency.” Say “your team closed 12% more tickets per rep in Q2 — roughly 4 hours per rep per week.” If you don’t have outcome data yet, align on what you’ll track together next quarter.
4. Open Risks and Issues
Name the risks: unresolved tickets, a champion who left, a renewal with no sponsor. List each with a status (open / in progress / resolved) and an owner. Customers who see you flagging risks early trust you more, not less.
5. Next Quarter Plan
End with a concrete plan. Three to five priorities, each with an owner and a date. Not “we’ll work on onboarding.” Instead: “By August 15, we’ll complete onboarding for the 6 inactive seats — Priya owns this on your side, I own it on ours.” Without this, QBRs feel like postmortems.
3 QBR Report Examples

Example 1: Early-Stage CS Team, SMB Customer
Context: 10-person SaaS, one CSM covering 40 accounts, 15-seat account, 6 months in.
- Health score: 71 — yellow, down from 78 due to open P2 ticket
- Adoption: 11 of 15 seats active, core feature adoption at 68%
- ROI: ~3 hrs/week saved on manual reporting
- Risk: 1 open P2 ticket, 3 weeks unresolved
- Q3 plan: Resolve ticket July 12, activate 4 remaining seats by August 1
Why it works: It’s honest. The CSM doesn’t pretend the yellow score away.
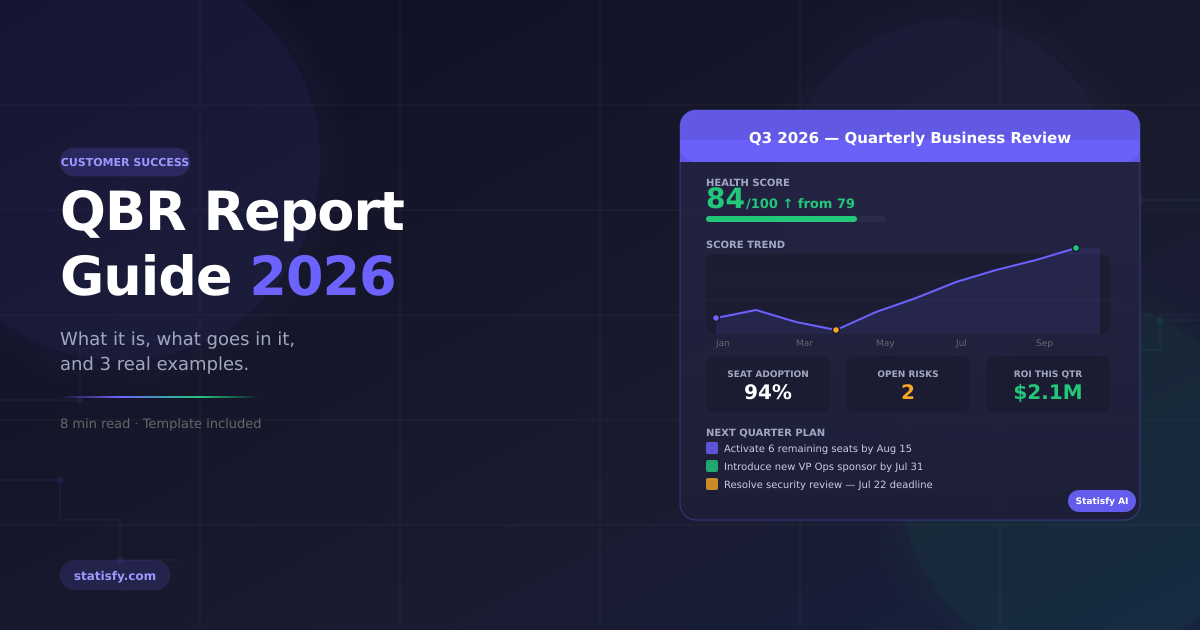
Example 2: Scaling CS Team, Mid-Market Customer
Context: 60-person SaaS, 50-seat account, 14 months in, renewal in 5 months.
- Health score: 84 — green, up from 79 in Q1
- Adoption: 47 of 50 seats active, 3 power users generating 60% of output volume
- ROI: 18% reduction in time-to-close; team handling 22% more tickets, same headcount
- Risk: Champion (VP of Ops) leaving in 6 weeks — no renewal sponsor identified
- Q3 plan: Introduce new sponsor by July 31; EBR with CTO before renewal
Why it works: The champion risk is named explicitly, with a concrete action attached.
Example 3: Enterprise CS Team, Large Account
Context: Named CSM + SA pairing. 500-seat global account, year 2 of a 3-year contract.
- Health score: Segmented — 88 EMEA, 76 APAC, 91 NA (not blended)
- Adoption: 79% globally; APAC at 61% — flagged as risk
- ROI: $2.1M documented efficiency gains in NA; APAC ROI not yet established
- Risks: APAC adoption lag; security review blocking integration; co-term needed Q4
- Q3 plan: 6-session APAC enablement sprint July–Aug; security resolution July 22
Why it works: Segmenting health by BU prevents a strong NA from masking a real APAC problem.
Get this level of detail without the manual pull
Start a free trial and Statisfy will segment health, adoption, and ROI by business unit automatically, so a strong region can't quietly mask a real problem in another one.
How to Run a QBR That Doesn’t Get Canceled
Most QBRs get canceled because they’re built for the CSM, not the customer. The agenda should be built around the customer’s business goals — your metrics are evidence, not the story.
Three things that kill QBRs:
- Wrong people in the room. If you’re presenting to a power user instead of an economic buyer, you’re rehearsing. Push for an exec. If you can’t get one, ask why — that’s a signal.
- Surprise slides. Never surface a red metric or a risk for the first time in a QBR. Use the QBR to discuss resolution, not deliver news.
- No forward commitment. A QBR without a jointly agreed next-quarter plan is just a recap. Get the customer to commit before you close the call.
From Data to Deck: The Two Challenges of QBR Prep
A QBR has two distinct jobs: (1) gathering the right content — health scores, usage data, ROI evidence, risk flags — and (2) assembling it into a polished, shareable presentation deck. Most CS teams struggle with both.
Can Claude Help?
Yes — with the right setup. Claude (Anthropic’s AI) can generate structured QBR slide content if you connect it to your data sources via MCP (Model Context Protocol). In principle, you wire up your CRM, product analytics, support platform, and meeting notes, then prompt Claude to draft the full QBR narrative and slide structure.
In practice, connecting and maintaining those integrations is the bottleneck. Each data source requires separate authentication, schema mapping, and ongoing sync — weeks of setup before Claude can generate anything useful.
This Is Where Statisfy’s MCP Server Changes the Equation
Statisfy already aggregates your CRM, product usage, support history, health score signals, and meeting intelligence across 50+ native integrations. By connecting Statisfy’s MCP server to Claude, you give Claude a single, pre-integrated data layer — no individual tool plumbing required.
The workflow becomes:
- CSM opens Claude and connects via Statisfy MCP
- Claude pulls live account context — health score, adoption, risks, last QBR commitments — directly from Statisfy
- Claude generates a complete QBR outline, narrative, and slide-ready content in the format you need
- CSM reviews, adds relationship context, and shares with the customer
Statisfy handles the integration layer. Claude handles the generation. The CSM handles the judgment.
How Statisfy Generates a QBR Report
Statisfy’s QBR Agent generates a structured, slide-ready QBR draft in under a minute. Here’s what it handles — and what stays with you.
What Statisfy Handles
- Health score with 90-day trend and signal breakdown (powered by Predict)
- Seat activation rate, feature adoption by tier, power user identification
- Auto-flagged risks: aging tickets, champion churn signals, adoption drops
- ROI section drafted from in-product data and previous customer-reported metrics
- Historical continuity: commitments from the last QBR surface as open or resolved — automatically
- Slide deck generated in your template — not a Google Doc that still needs formatting
What You Still Own
- Relationship context. Political dynamics, champion health, budget pressures. Statisfy won’t know the VP of Ops is quietly interviewing elsewhere.
- Tone and framing. A yellow score means something different at month 6 vs. year 3.
- Strategic narrative. The data tells what happened. You decide what it means for this customer, at this moment.
Statisfy makes prep faster and more consistent. The CSMs who get the most out of it use the time saved to do more of what moves retention: deeper discovery, stronger stakeholder relationships, and better next-quarter planning.
FAQ
How long should a QBR report be?
10–15 slides, 45-minute conversation. Anything past 20 slides is usually padding. If you need more than 15 slides to tell the story, the story needs editing.
What’s the difference between a QBR and an EBR?
A QBR is CSM-led, quarterly, operational. An EBR is senior-to-senior, annual or semi-annual, strategic. Make sure the right stakeholder level is in the room for the conversation you’re having.
What metrics should a QBR include?
Health score and trend, seat activation rate, feature adoption for core workflows, support ticket volume and resolution time, time-to-value for new users, and at least one outcome metric tied to the customer’s business goal. If you can’t show one, making that data available is the next quarter’s priority.
Build Your Next QBR With AI Behind It
Running consistent, high-quality QBRs at scale is hard when every CSM is building their own deck from scratch each quarter. Statisfy’s AI-powered QBR Agent pulls your health score, adoption data, account history, and meeting context into a structured, slide-ready review — so your team spends time on the conversation, not the prep.
Generate your next QBR deck in under a minute
Start a free trial and connect the QBR Agent to your CRM, product usage, and support data — your next review draft will be slide-ready before your next prep session would have even started.