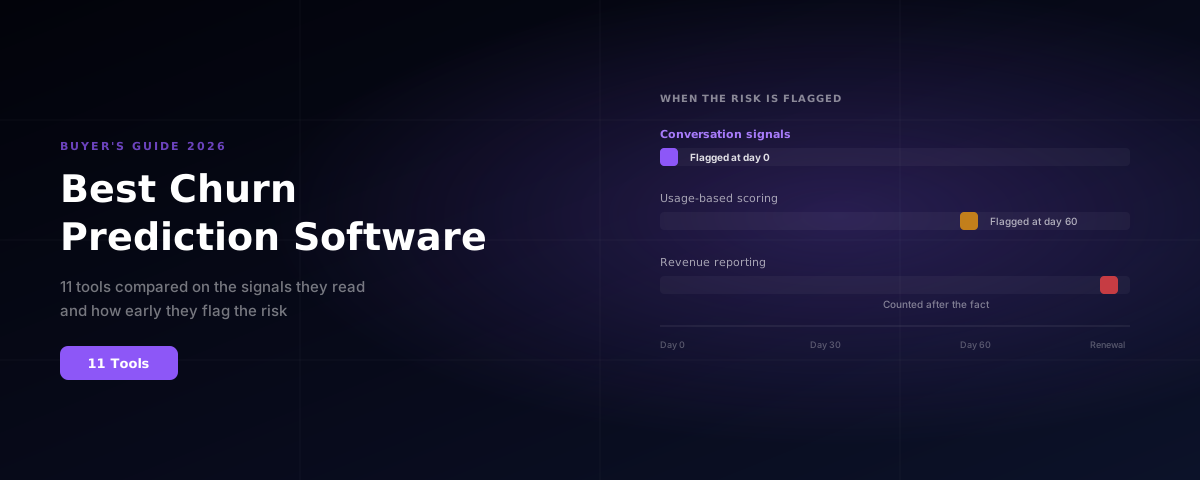
Best Churn Prediction Software in 2026: 11 Tools Compared
By Munish Gandhi · Founder & CEO, Statisfy
The best churn prediction software in 2026 falls into four groups: AI-native customer success platforms that read conversations as well as usage (Statisfy), configurable enterprise CSPs with rules-based health scoring (Gainsight, ChurnZero, Totango, Planhat, Vitally, Custify), product analytics tools that predict from behavioural data (Pendo, Amplitude), and subscription analytics or retention tools for self-serve businesses (Baremetrics, Churnkey).
The distinction that matters more than any feature list is which signals the model reads. Almost every tool on this page can tell you that an account’s usage has dropped. Very few can tell you anything before it does, and by then the customer has usually already made the decision.
Disclosure: Statisfy is one of the tools compared here. Competitor summaries below are neutral characterizations of public positioning, not vendor claims, and setup times and pricing should be confirmed with each vendor in writing.
Why usage data alone flags churn late
Here is the same account, told twice.
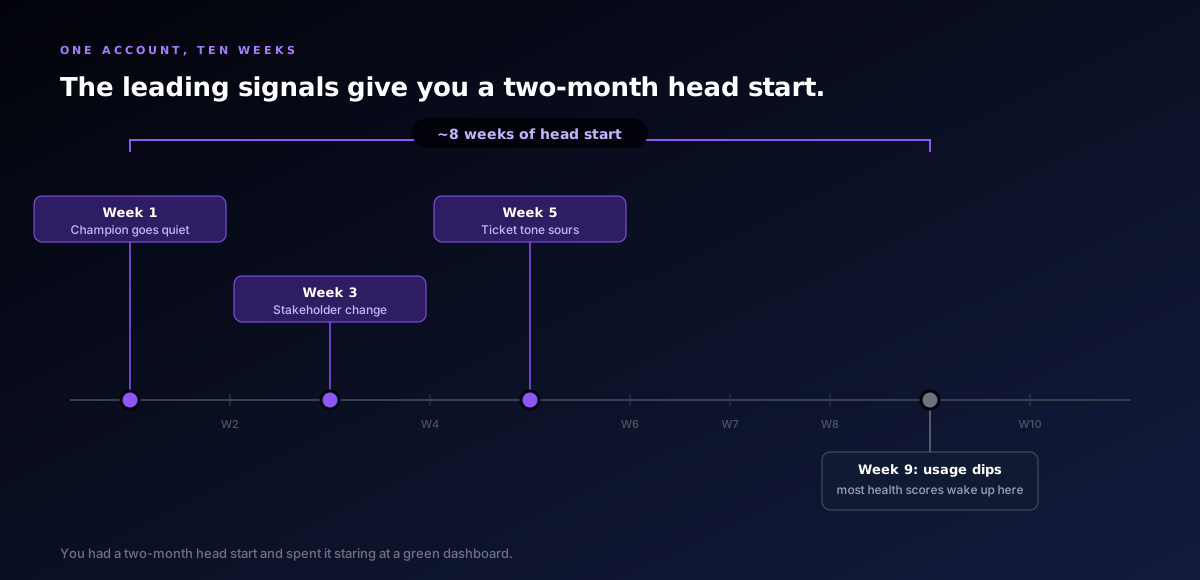
On day 0, a stakeholder goes quiet on a call. Sentiment shifts. Usage is still flat, so no dashboard reacts. On day 30, if your model read that first signal, the save play has already run: the outreach sent, the meeting brief prepared, the CRM updated. On day 60, usage finally dips. This is where a usage-based health score notices, and the decision to leave was made a month ago. On day 90 the renewal lands, and you are either following up on a save play you ran in month one or having a very different conversation.
The buying question: not “does this tool predict churn” but “how many days of warning does it buy me, and what happens in those days”. A tool that flags risk at day 60 and hands a CSM a task is a very different purchase from one that flags at day 0 and has already drafted the email.
This is why the phrase predicting customer churn using usage data is doing a lot of quiet work in most vendor marketing. Usage is the easiest signal to instrument and the last one to move.
The six signals a churn model should read
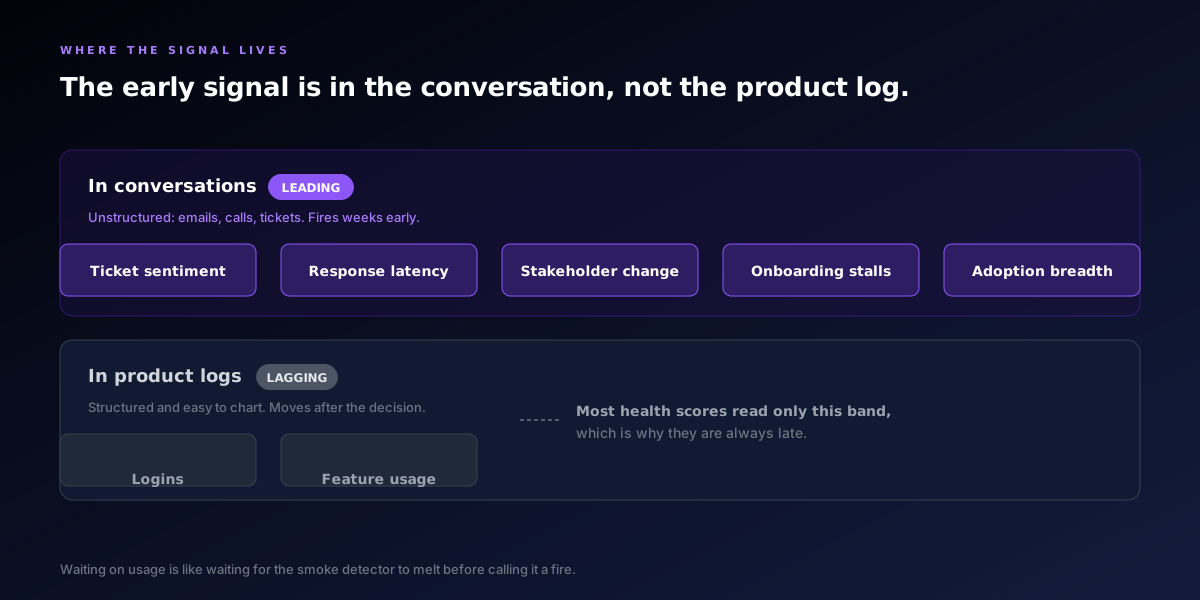
When you evaluate any tool on this list, check it against six signals rather than one. Five of them live in conversations, not in your product database.
Tone changes before behaviour does. The account that stops asking about the roadmap is telling you something.
The single highest-signal event in B2B SaaS. Your sponsor leaves and the renewal has a new owner who never bought it.
Response latency is measurable and leading. A thread that used to turn around in hours now takes a week.
Not ticket volume, which is noisy, but the shape: repeat escalations on the same workflow, rising severity.
Real, measurable, and late. Worth reading, but as confirmation of a decision rather than a warning about one.
The absence of activity is itself a signal, and the one a usage dashboard is structurally worst at seeing.
Ask every vendor on your shortlist which of these six their model actually ingests, and whether each factor is visible and auditable in the score. A score you cannot explain in a board review is not a score you can act on.
How the tools on this list were assessed
Each tool below is assessed on five things: the signals the model reads, how early it flags risk relative to a usage dip, what happens after the flag, realistic time to first value, and who it genuinely fits. Setup times are order-of-magnitude characterizations from public positioning and should be confirmed with each vendor.
The 11 best churn prediction software tools in 2026
1. Statisfy
Best for: account-managed B2B SaaS teams that want the churn signal before usage dips, with the save play already drafted.
Statisfy is the AI-native option on this list. It reads calls, email, and Slack alongside product usage and CRM, which is what makes the score predictive rather than descriptive. On the same account, the signal surfaces around 30 days sooner than a usage-based score would catch it.
Health scoring is zero-config LLM scoring, so there is no rules engine to hand-tune and nothing that silently goes stale when the product changes. Every factor in the score is visible and auditable. Prediction is not where it stops: the save email is drafted in your team’s voice and grounded in the account’s own history, renewal briefs are produced at 60, 30, and 14 days out, and routine saves can send themselves while high-stakes accounts escalate for a human to approve. The same six signals run in the other direction too, so usage spikes and new stakeholders surface as expansion rather than risk.
Customers report the downstream numbers: Observe.ai saw a 2% gross revenue retention lift and roughly 150 hours saved weekly; Milestone brought churn down 15%. Typical deployment is 2 to 3 weeks across 50 or more integrations.
Where it is weaker: it assumes you have conversation data to read. If your book is entirely self-serve with no calls, no CSM email threads, and no shared Slack channels, most of the leading-signal advantage disappears and a product analytics or subscription tool is the more honest choice.
2. Gainsight
Best for: large enterprises with a dedicated CS Ops team to own and maintain the scoring model.
Gainsight is the category creator and remains the most configurable churn scoring engine on the market. You can model almost any risk hypothesis you can articulate, weight it, and attach a CTA to it. For an organization with 50 or more CSMs and someone whose job title includes “Gainsight admin”, that configurability is a genuine strength.
The trade is that configurability is work. The scoring model is only as good as the rules someone wrote and maintains, implementation is a multi-quarter project rather than a sprint, and health scores drift when the admin function is under-resourced. Its prediction is fundamentally usage-and-rules based, with AI as a layer on top rather than the core.
Where it is weaker: time to first value, and the standing cost of keeping the model current.
3. ChurnZero
Best for: mid-market renewal teams that want playbooks attached directly to the risk score.
ChurnZero is built for teams of roughly five to thirty CSMs where churn prevention is the primary KPI, and the tie between a score crossing a threshold and a playbook firing is tight and well executed. Its in-app communication layer (announcements, surveys, walkthroughs inside the customer’s product) means the intervention can reach users directly rather than only through a CSM.
Scoring is a configurable weighted model over usage, support, and survey data, so it inherits the usual lag: it reads the signals that move last. AI is an add-on layer rather than the scoring core.
Where it is weaker: the model still waits for behaviour to change before it reacts.
4. Totango (with Catalyst)
Best for: teams that want to adopt risk scoring as one module in a composable rollout.
Totango, now combined with Catalyst, takes a module-based approach: you can stand up a risk and renewal module without committing to the entire platform on day one. That suits organizations that want to prove value on one motion before expanding, and it lowers the size of the first bet.
Prediction is usage-and-segment based, and the composability that makes rollout easy also means the risk model sits alongside your data rather than unifying it.
Where it is weaker: a modular footprint can leave the risk score reading a narrower slice of the account than a unified model would.
5. Planhat
Best for: teams that want a unified customer data model underneath the churn score.
Planhat’s strength is its data model. Teams that need a customer data backbone (and want the churn score computed over the same objects that drive reporting, revenue, and operations) tend to like it for exactly that reason. If your problem is that churn signals are scattered across five systems that disagree with each other, Planhat is addressing the right layer.
Modelling the data well is not the same as predicting from it early, though. The score is still built from configured formulas over largely behavioural inputs.
Where it is weaker: it improves what the score is computed over, not how early the inputs move.
6. Vitally
Best for: product-led and analytics-heavy teams whose usage data is already clean and granular.
Vitally is popular with product-led teams for its dashboards and data views, and if your product instrumentation is genuinely good (clean event streams, meaningful feature-level adoption, reliable account mapping) it turns that into segmentation and risk views quickly. For PLG motions where usage really is the dominant signal, that is a reasonable bet rather than a compromise.
Configuration depth tends to climb as you scale, and the quality ceiling is set by your instrumentation.
Where it is weaker: it is a strong reader of the one signal that moves last.
7. Custify
Best for: small teams that want usage-based health scoring without hiring a CS Ops function.
Custify is deliberately lighter and faster to deploy than the enterprise platforms, aimed at smaller teams who want account health visibility without a configuration project. If you have outgrown a spreadsheet but a Gainsight implementation would consume your whole year, this is the proportionate answer.
It is a tracker first. Scoring is simpler, AI capability is limited, and the outreach after the flag is yours to write.
Where it is weaker: it alerts, and everything after the alert is manual.
8. Pendo
Best for: product teams that want in-app usage signals and the ability to intervene inside the product.
Pendo is not a customer success platform, and it is worth including precisely because many teams try to use it as one. Its strength is depth of product usage data plus the ability to act on it in-app: if declining feature adoption is the risk you are targeting, Pendo both sees it and can put a guide in front of the user without anyone sending an email.
It has no view of your calls, your CRM pipeline, or your renewal dates. It answers “is this user adopting the product” rather than “is this account going to renew”.
Where it is weaker: no commercial context, so it cannot rank risk by revenue at stake.
9. Amplitude
Best for: data teams that want to build and own a behavioural churn model rather than buy a score.
Amplitude is the serious option for teams that want the raw behavioural substrate and their own model on top: cohort analysis, retention curves, and predictive audiences built from event data. If you have an analytics function that wants to own the definition of churn risk, this gives them the material to do it properly.
It is a tool for analysts, not a workflow for CSMs. Nothing downstream happens because a score changed unless you build that too.
Where it is weaker: it is an input to a churn programme, not a churn programme.
10. Baremetrics
Best for: self-serve and subscription businesses that need churn measured accurately by revenue.
Baremetrics sits on your billing data and answers the revenue questions precisely: gross and net revenue churn, MRR movements, cohort retention, and where in the lifecycle revenue is leaking. For a self-serve business with thousands of small accounts and no CSMs, this is the correct instrument.
It is measurement rather than prediction. It tells you accurately what already happened, which is the right job for a different question than the one this page is about.
Where it is weaker: by design, it counts churn after the fact.
11. Churnkey
Best for: self-serve subscription businesses that want to intervene at the moment of cancellation.
Churnkey works at the other end of the timeline entirely: cancel-flow experiments, targeted offers, pause options, and failed-payment recovery. It is the most direct intervention on this list because it acts at the exact moment a customer is leaving, and involuntary churn recovery in particular is real revenue that most teams under-invest in.
It is not prediction in any meaningful sense. It catches the churn event rather than forecasting it.
Where it is weaker: by the time it fires, the day-0 signal was eight weeks ago.
See which of your accounts the model flags
20 minutes, your own book of accounts, no slides. If the model does not flag anything useful, we will tell you that on the call.
Churn prediction software compared side by side
| Tool | Category | Signals read | Flags risk | After the flag | Setup | Best for |
|---|---|---|---|---|---|---|
| Statisfy | AI-native CSP | Calls, email, Slack, usage, CRM, support | ~30 days before a usage dip | Drafts and runs the save play | 2 to 3 weeks | Account-managed B2B SaaS that wants the work done |
| Gainsight | Enterprise CSP | Usage, support, survey, CRM (rules-based) | On configured thresholds | Raises a CTA for a CSM | Multi-quarter | Enterprises with a CS Ops team |
| ChurnZero | CSP | Usage, support, survey, in-app | On configured thresholds | Fires a playbook | Medium | Mid-market renewal teams |
| Totango (Catalyst) | CSP | Usage, segment, CRM | On configured thresholds | Module-level playbooks | Medium | Composable, phased rollouts |
| Planhat | CSP + data model | Unified account data, usage, CRM | On configured formulas | Alerts and workflows | Medium | Teams wanting one data backbone |
| Vitally | CSP | Product usage, CRM | On a usage dip | Alerts and dashboards | Medium | Product-led teams with clean data |
| Custify | Lightweight CSP | Product usage, support | On a usage dip | Alerts a CSM | Fast | Small teams, no CS Ops |
| Pendo | Product analytics | In-app behaviour only | On an adoption drop | In-app guide or survey | Fast to medium | Product teams intervening in-app |
| Amplitude | Behavioural analytics | Event data you instrument | Whatever you model | Nothing, unless you build it | Depends on your team | Data teams building their own model |
| Baremetrics | Subscription analytics | Billing and revenue data | After the churn event | Reporting | Fast | Self-serve revenue measurement |
| Churnkey | Retention and cancel flow | Cancellation and payment events | At cancellation | Offer, pause, or dunning | Fast | Self-serve cancel-flow recovery |
Setup and pricing vary by vendor and by scope, so confirm both in writing. Competitor cells are neutral summaries of public positioning, not vendor claims.
Should you build your own churn model instead?
A warehouse-native model on BigQuery ML, Snowflake, or dbt plus a gradient-boosted classifier is a legitimate option, and for a data team that already owns clean account-level features it can outperform a generic vendor score on your specific product.
Be honest about what it costs. You are buying a model, not a programme: someone has to own feature engineering, retrain as the product changes, monitor for drift, and build every downstream workflow the vendor tools ship by default. Most teams that build get a good score and then discover the score was the easy part. We walk through that trade in build vs buy an AI CSM, and the modelling side in churn prediction models.
When should you not choose Statisfy?
We would rather you pick the right tool than the wrong one.
Your book is entirely self-serve. No calls, no CSM email threads, no shared Slack channels means no conversation data, and the leading-signal advantage that makes Statisfy worth buying is gone. Baremetrics for measurement and Churnkey for cancel-flow recovery will serve you better.
You need a deeply bespoke, hand-configured scoring model and have the team to own it. If your value comes from intricate custom rulesets and branched CTAs, and you have a CS Ops function that enjoys building them, a mature incumbent like Gainsight is the better fit. That configurability is a real strength.
You only want a dashboard and plan to do all the outreach yourselves. A lighter tracker like Custify will cost less and do that job.
How to choose churn prediction software
Pick by your constraint, not the feature list
Four questions, in the order that actually narrows the shortlist.
Whatever you shortlist, run the same test on every vendor: bring a book of accounts that already churned, and ask when their model would have flagged each one. A tool that flags at the usage dip is telling you about a decision that was made a month earlier. For the practitioner view of acting on the flag, see how to identify customers at risk of churning and the customer health score mechanics behind the number.
Frequently asked questions
What is the best churn prediction software?
There is no single best tool; the right one depends on what data you have and what you want to happen after the flag. Statisfy is the strongest fit for account-managed B2B SaaS because it reads conversations alongside usage and runs the save play, Gainsight suits large enterprises with a CS Ops team to own the scoring rules, ChurnZero suits mid-market renewal teams, Vitally and Custify suit product-led teams with clean usage data, and Baremetrics or Churnkey suit self-serve subscription businesses.
Can you predict customer churn from usage data alone?
You can, but usage is a lagging signal. By the time logins and feature adoption drop, the customer has usually already decided. Usage-only models tend to flag risk around the point where the decision is made rather than before it, which is why the strongest churn prediction software combines usage with conversation signals such as sentiment shift, stakeholder change, and response latency.
How far in advance can churn prediction software flag an at-risk account?
It depends on the signals the model reads. A usage-based health score typically turns red when engagement drops, which in B2B SaaS is often 30 to 60 days before renewal. Models that also read calls, email, and Slack pick up sentiment and stakeholder changes earlier; Statisfy flags risk around 30 days sooner than a usage-based score on the same account.
What is the difference between churn prediction software and a customer health score?
A health score is a descriptive summary of where an account stands today, usually a weighted formula over usage, support, and survey data. Churn prediction software is predictive: it estimates the likelihood that an account leaves within a future window. Many tools ship a health score and call it prediction, so the question to ask a vendor is what the score predicted and how often it was right.
How much does churn prediction software cost?
Most enterprise customer success platforms do not publish list pricing and are custom-quoted by seat and module, while subscription analytics tools such as Baremetrics and ChartMogul publish tiered pricing based on tracked revenue. Compare total cost of ownership rather than licence cost: implementation, data engineering, and any CS Ops headcount needed to keep the scoring rules current.
Do you need a data scientist to run a churn prediction model?
Not for an off-the-shelf tool. You need a data scientist if you build your own model on a warehouse stack such as BigQuery ML or Snowflake, and you need ongoing ownership to retrain it as the product changes. Most CS teams are better served buying a tool where scoring is either configured in the UI or, with LLM-based scoring, requires no rules to hand-tune at all.
See it on your own accounts
The fastest way to compare any two tools on this list is to point them at accounts you already lost and see which one would have said something first. Bring a book of accounts to a 20 minute call and we will show you what the model flags and why. If it does not flag anything useful, we will tell you that on the call.
Churn prediction that runs the save play
Statisfy reads calls, email, and Slack alongside usage, so the signal shows up around 30 days sooner and the outreach is already drafted.